Logs
The LocalMaps Logs interface provides detailed insights into the system’s operations and interactions. Here’s a guide to understanding the key components of the logs:
Log Components
Each log entry consists of the following key pieces of information:
- Level: Indicates the type of the log message.
- Source: The component or service that generated the log entry.
- Time: The timestamp indicating when the log entry was recorded. Note: The log times are displayed in UTC.
- Message: Describes the action taken or the event that occurred.
Log Levels
You can filter logs by different levels to focus on specific types of messages. The available log levels are:
- INFO: Informational messages that provide a record of the normal operation of the system.
- WARN: Potential issues which still allow the application to continue running.
- ERROR: Error conditions that impair some operation.
Accessing Logs

-
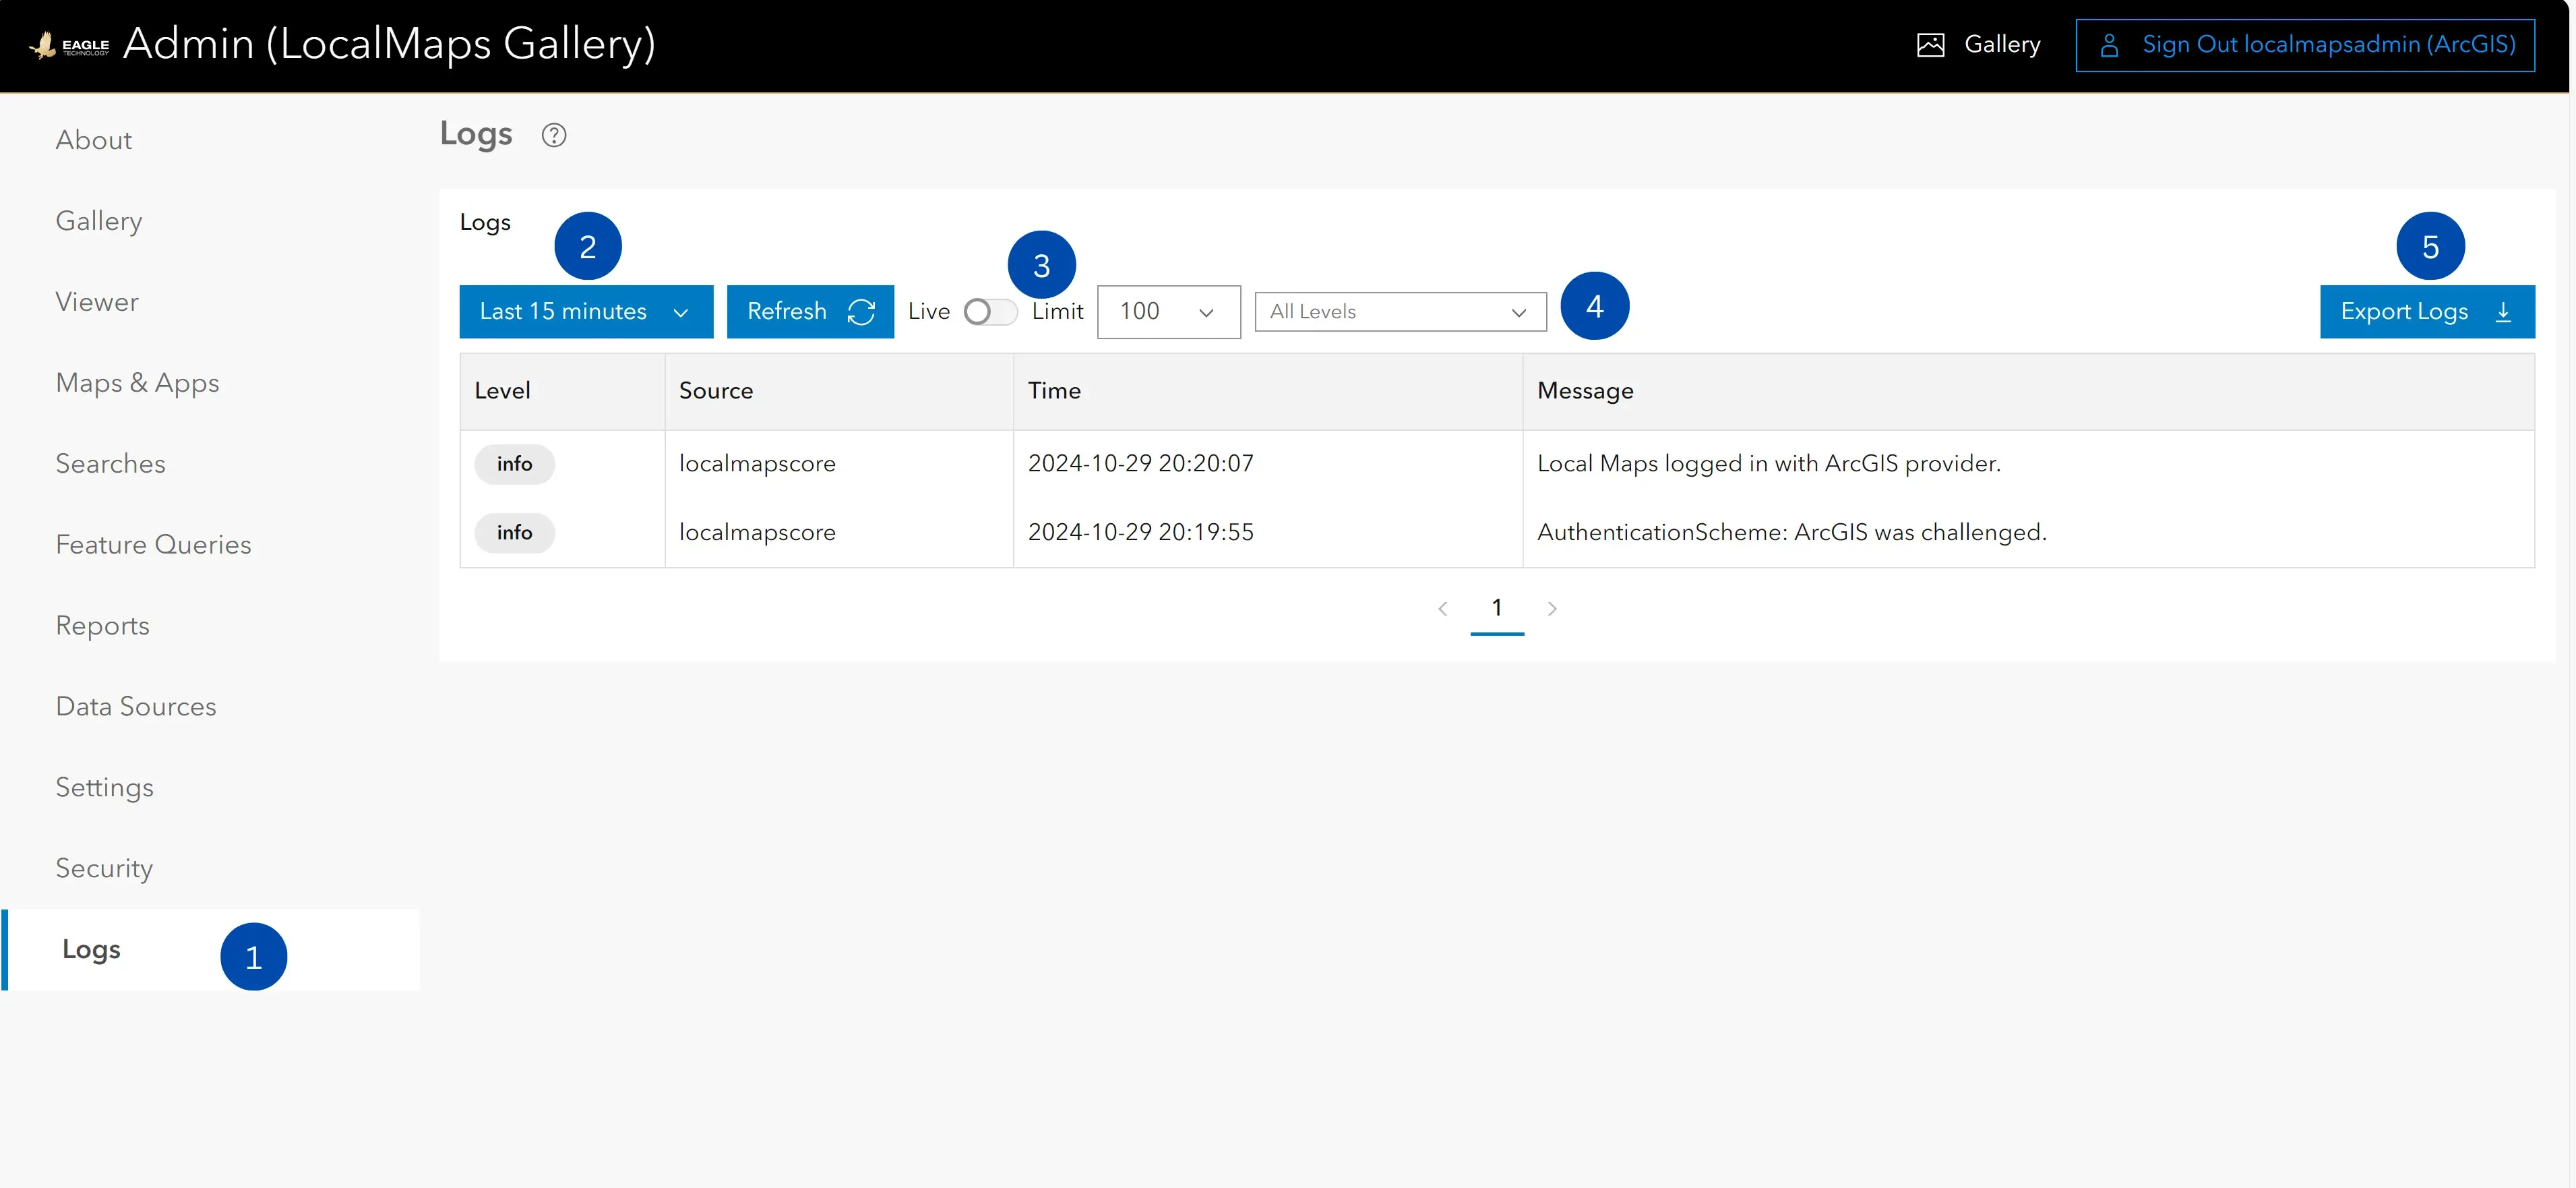
Navigate to Logs: From the LocalMaps Admin panel, select the “Logs” section in the sidebar.
-
Set Time Period: Define the start and end date and time to filter the logs for a specific period.
-
Toggle live or limit: Toggling this switch will either show the logs in real-time or limit the logs to the specified number.
-
Filter by type: Use the dropdown to filter logs by type.
-
Export Logs: Use the “Export Logs to CSV” button to download the logs for offline analysis.

