Reports
LocalMaps allows you to bring together maps, tables, and text elements to form one cohesive report through its reporting functionality. The data can be referenced on the fly through spatial query against the feature that is present in your maps or from your connected data sources. You can create your template through the admin panel and include elements such as images, tables, and maps as required.
Once created, reports can be added to one map or multiple maps provided they contain the appropriate layer the report was set up against. This can be done through the Maps and Apps section. Here is a guide to creating and generating reports through LocalMaps.
Pre-requisites
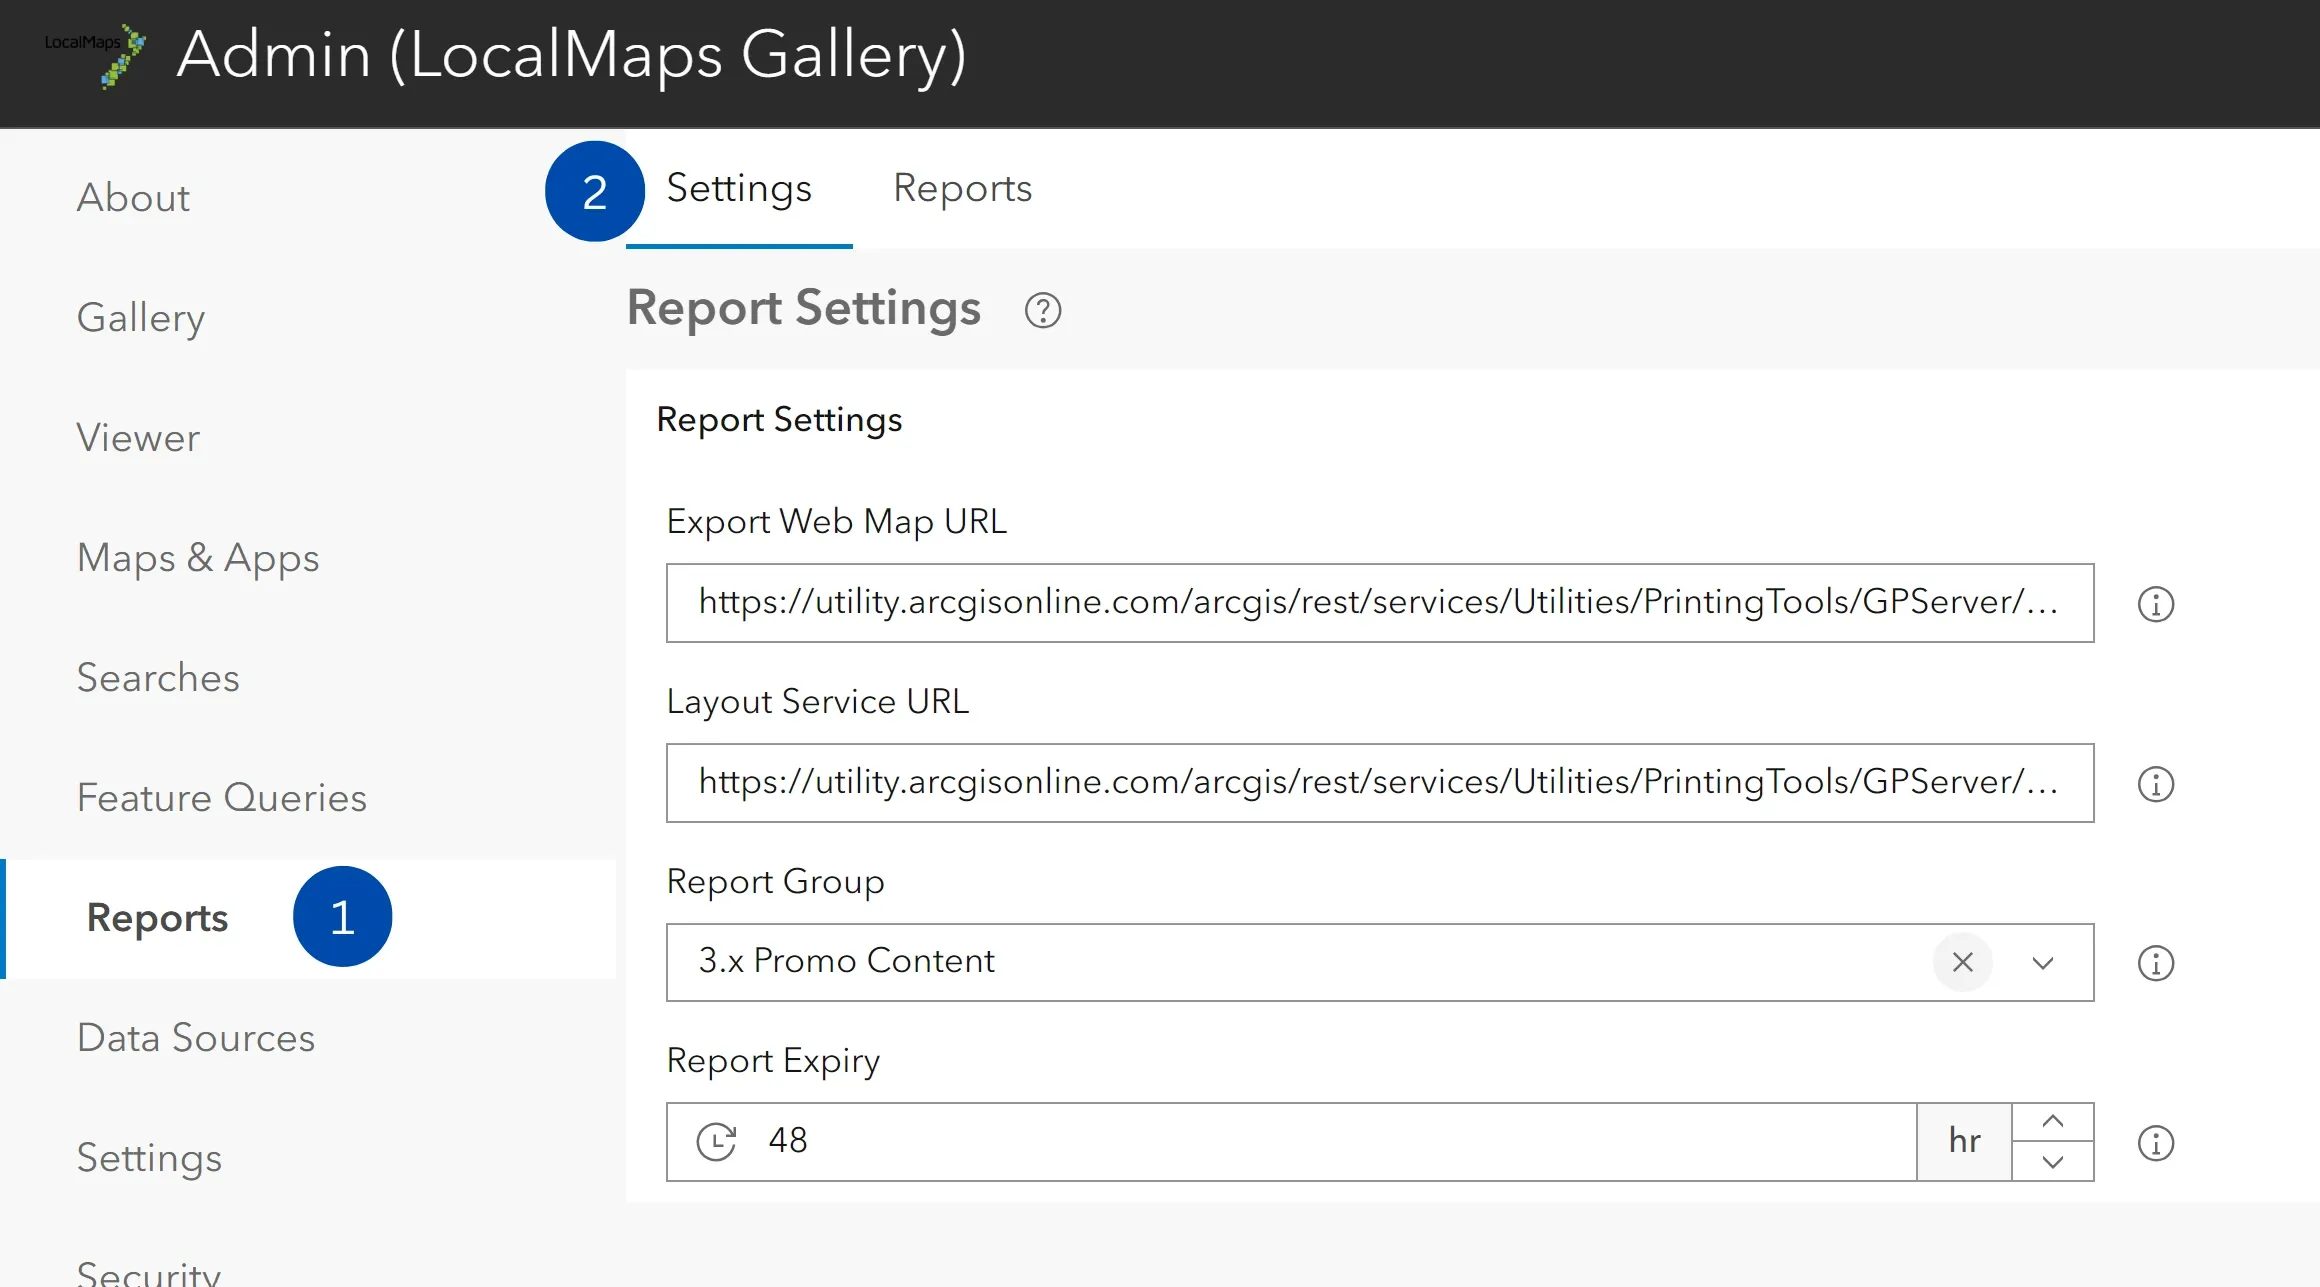
- Navigate to the admin panel and on the sidebar click on Reports.
- Select the report group under Report-> Settings.
- Select the report group here. Note: Ensure that this group is public and should have all the maps and layers that you want to include in your reports.
- Add export web map URL and Layout service URL that you want to base your report on. Note: Updating these services is optional, by default LocalMaps uses ArcGIS online services for generating reports. This will work fine but at times this may delay the report generation if the request traffic is too high on these services. We recommend generating and publishing services for the reports individually and adding them here.
- Select a time for the report expiry. Generated report will be available to download through the Viewer during this time.
Using templates in your report (available from v3.2 and above)
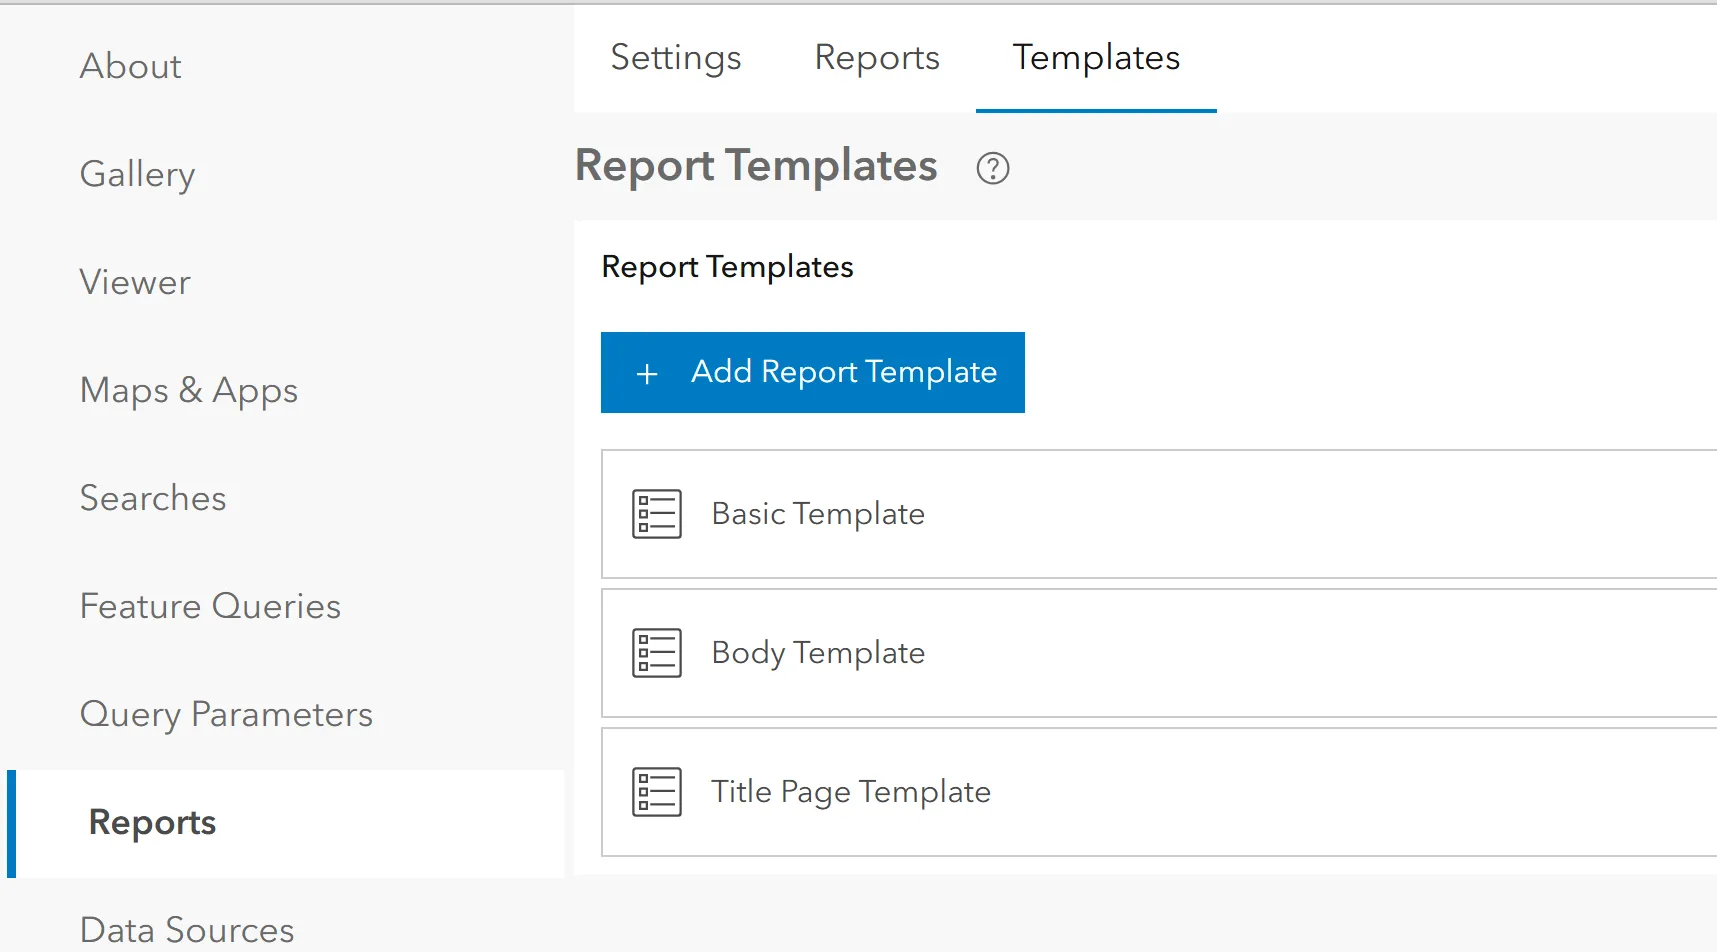
If you would like to use a template for your reports, navigate to Report-> Templates.
-
Click Add Report Template and give a unique name to identify this template.
-
Select a word(.docx) file from your locale to add as a template. This needs to be authored in Microsoft Word. This could have your organisations banner, logo and disclaimer in the page header or it could be left blank. You could also include placeholders with specific syntax
{{fieldname}}in that the LocalMaps reporting engine understands. Fields used can only be coming from the Report Layer being used. -
You are able to manage your templates by renaming, overwriting them with a new template, downloading and deleting any unused templates.
Tip: If you wish to use your template for all pages of your report, all elements MUST be in the header or footer of the document. If you only wish to use a template with specific syntax from your report layer, then you may have that in the body of the document (just know that specific information will then appear in the body of every page and could be overlapped with other elements you build in LocalMaps).
Creating a Report
-
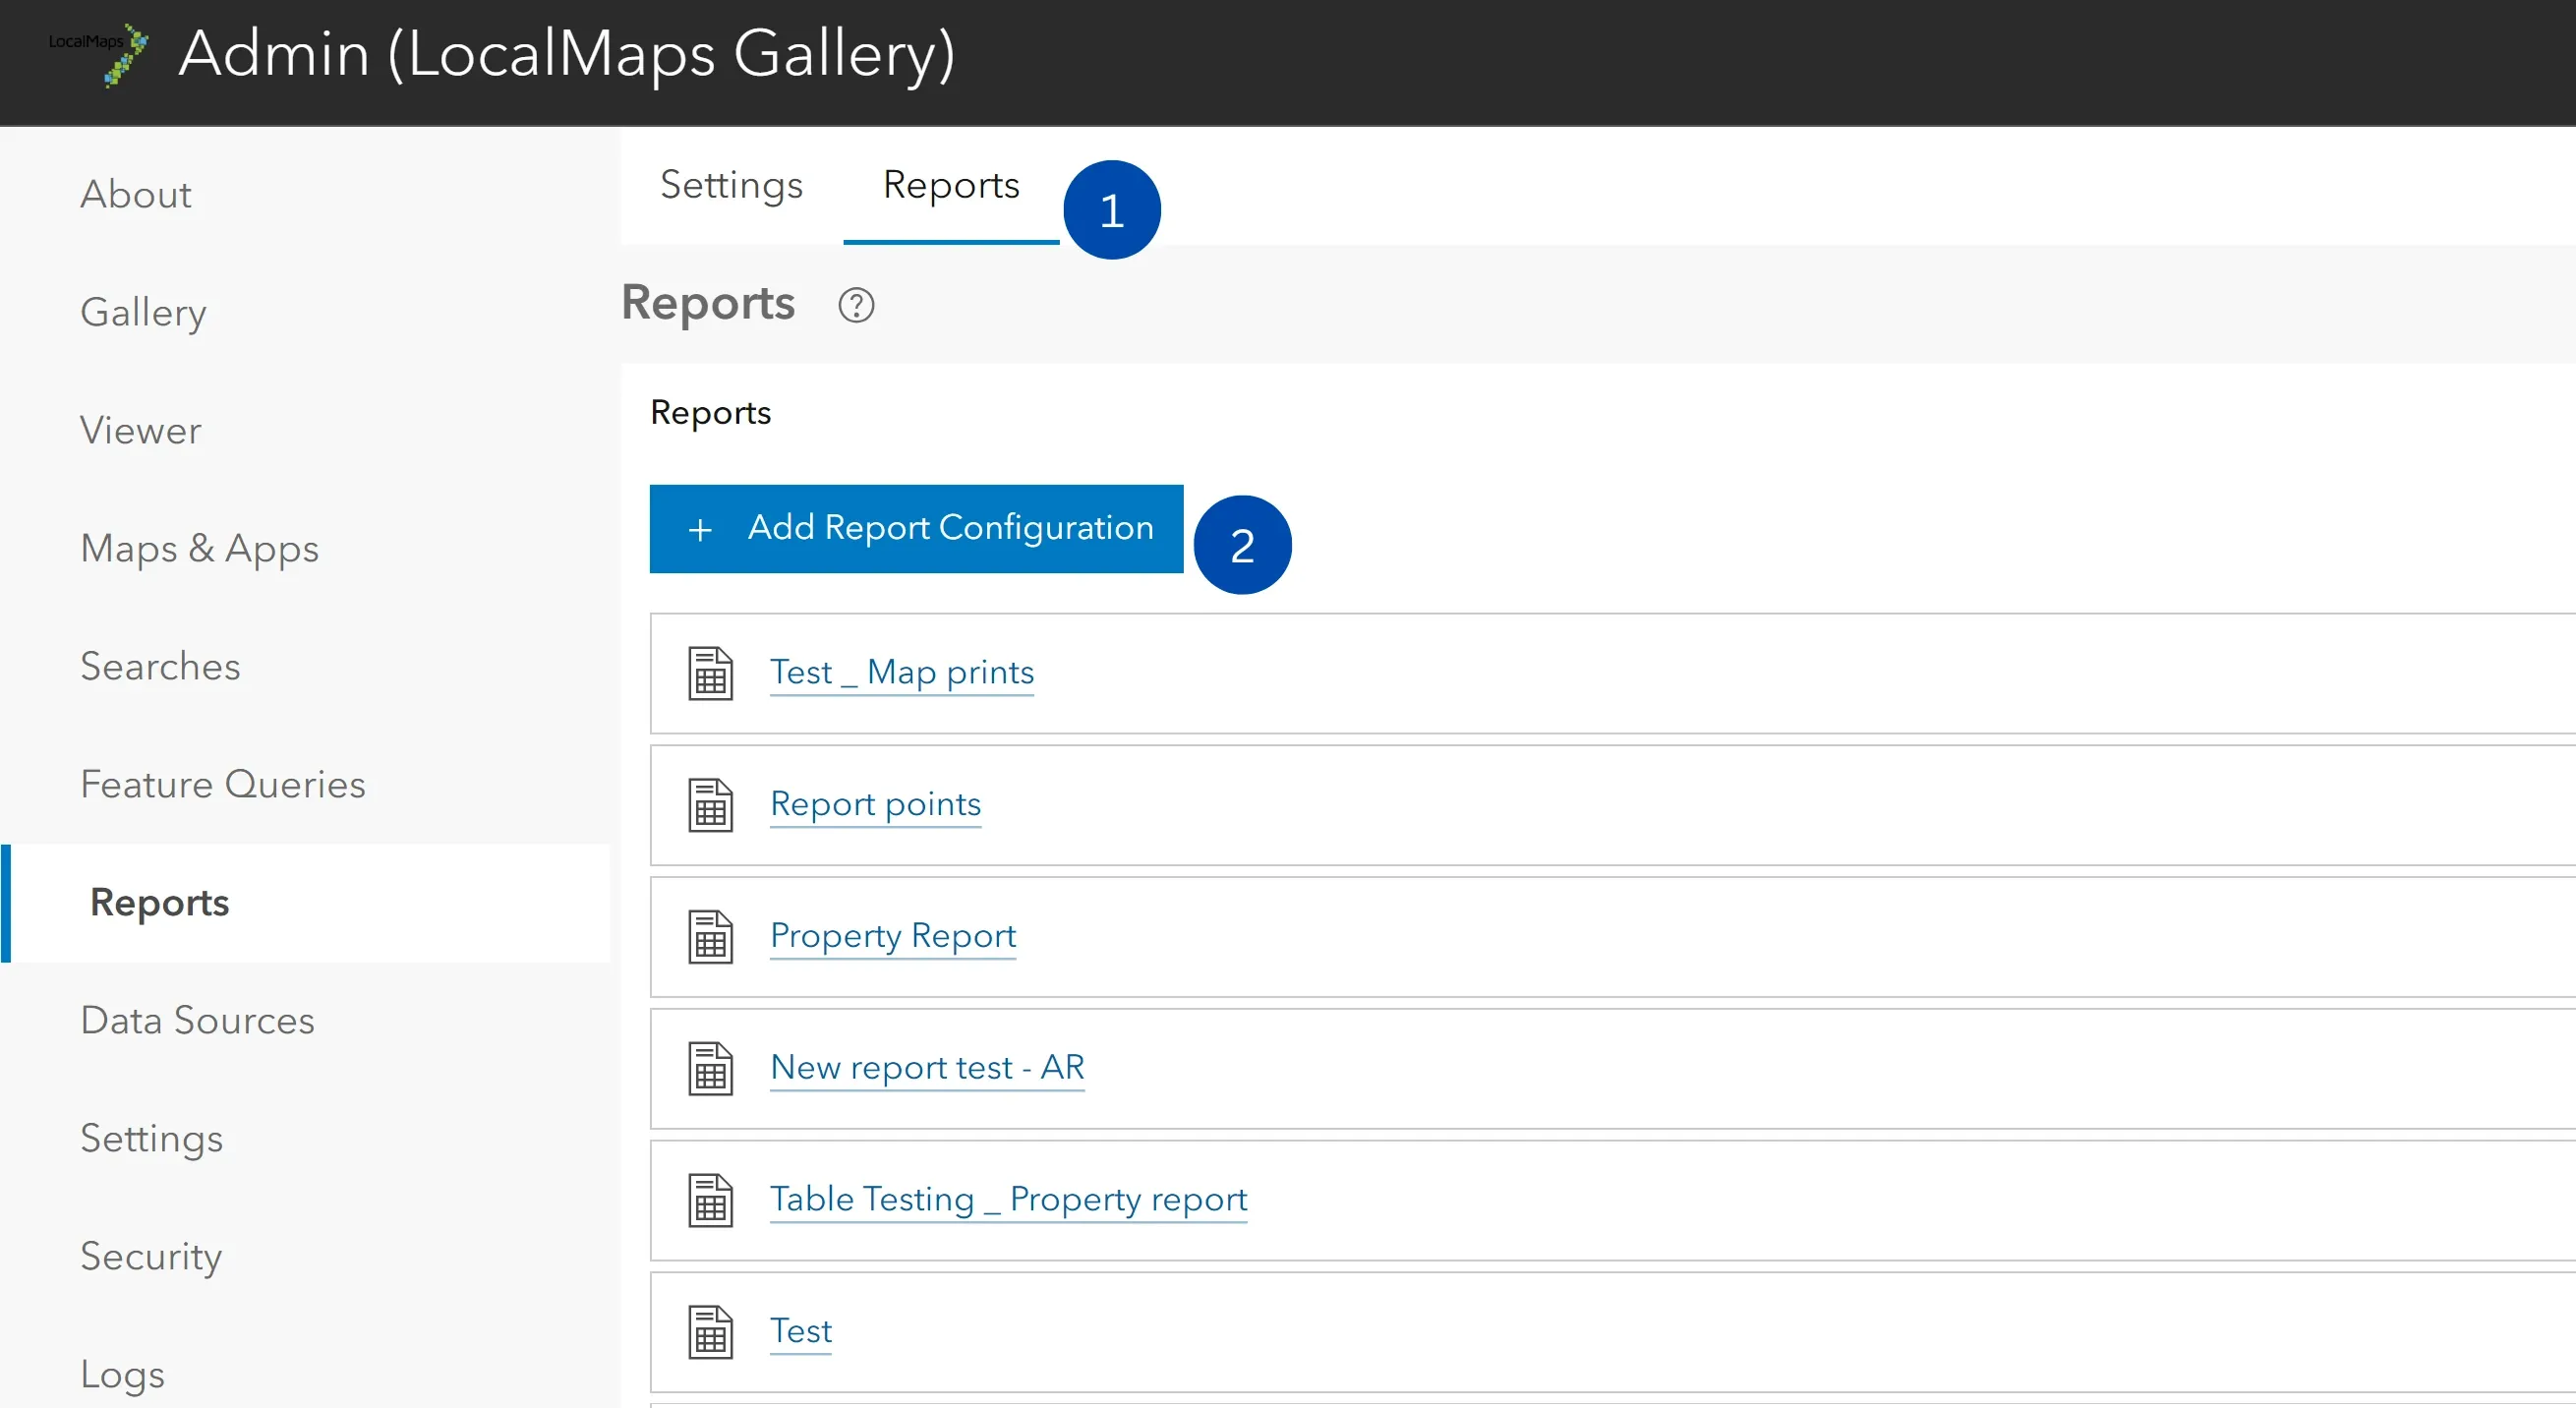
Click on the Reports -> and on the Reports section.
-
Click on Add Report Configuration to create a new report.
-
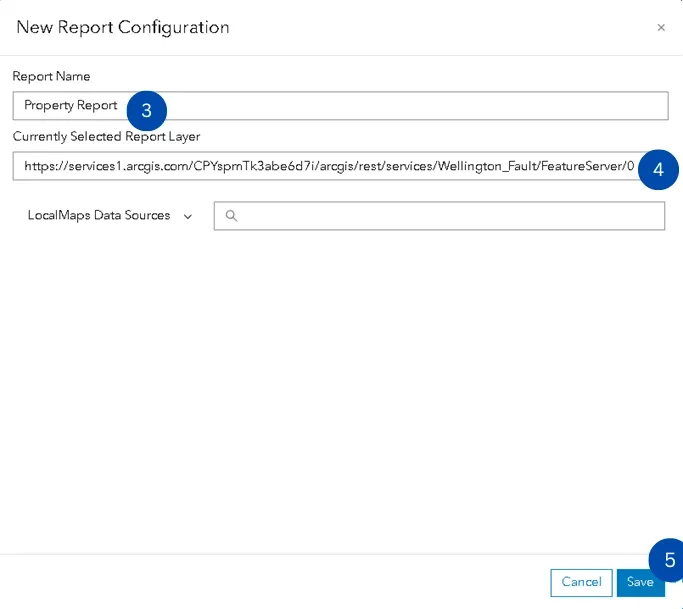
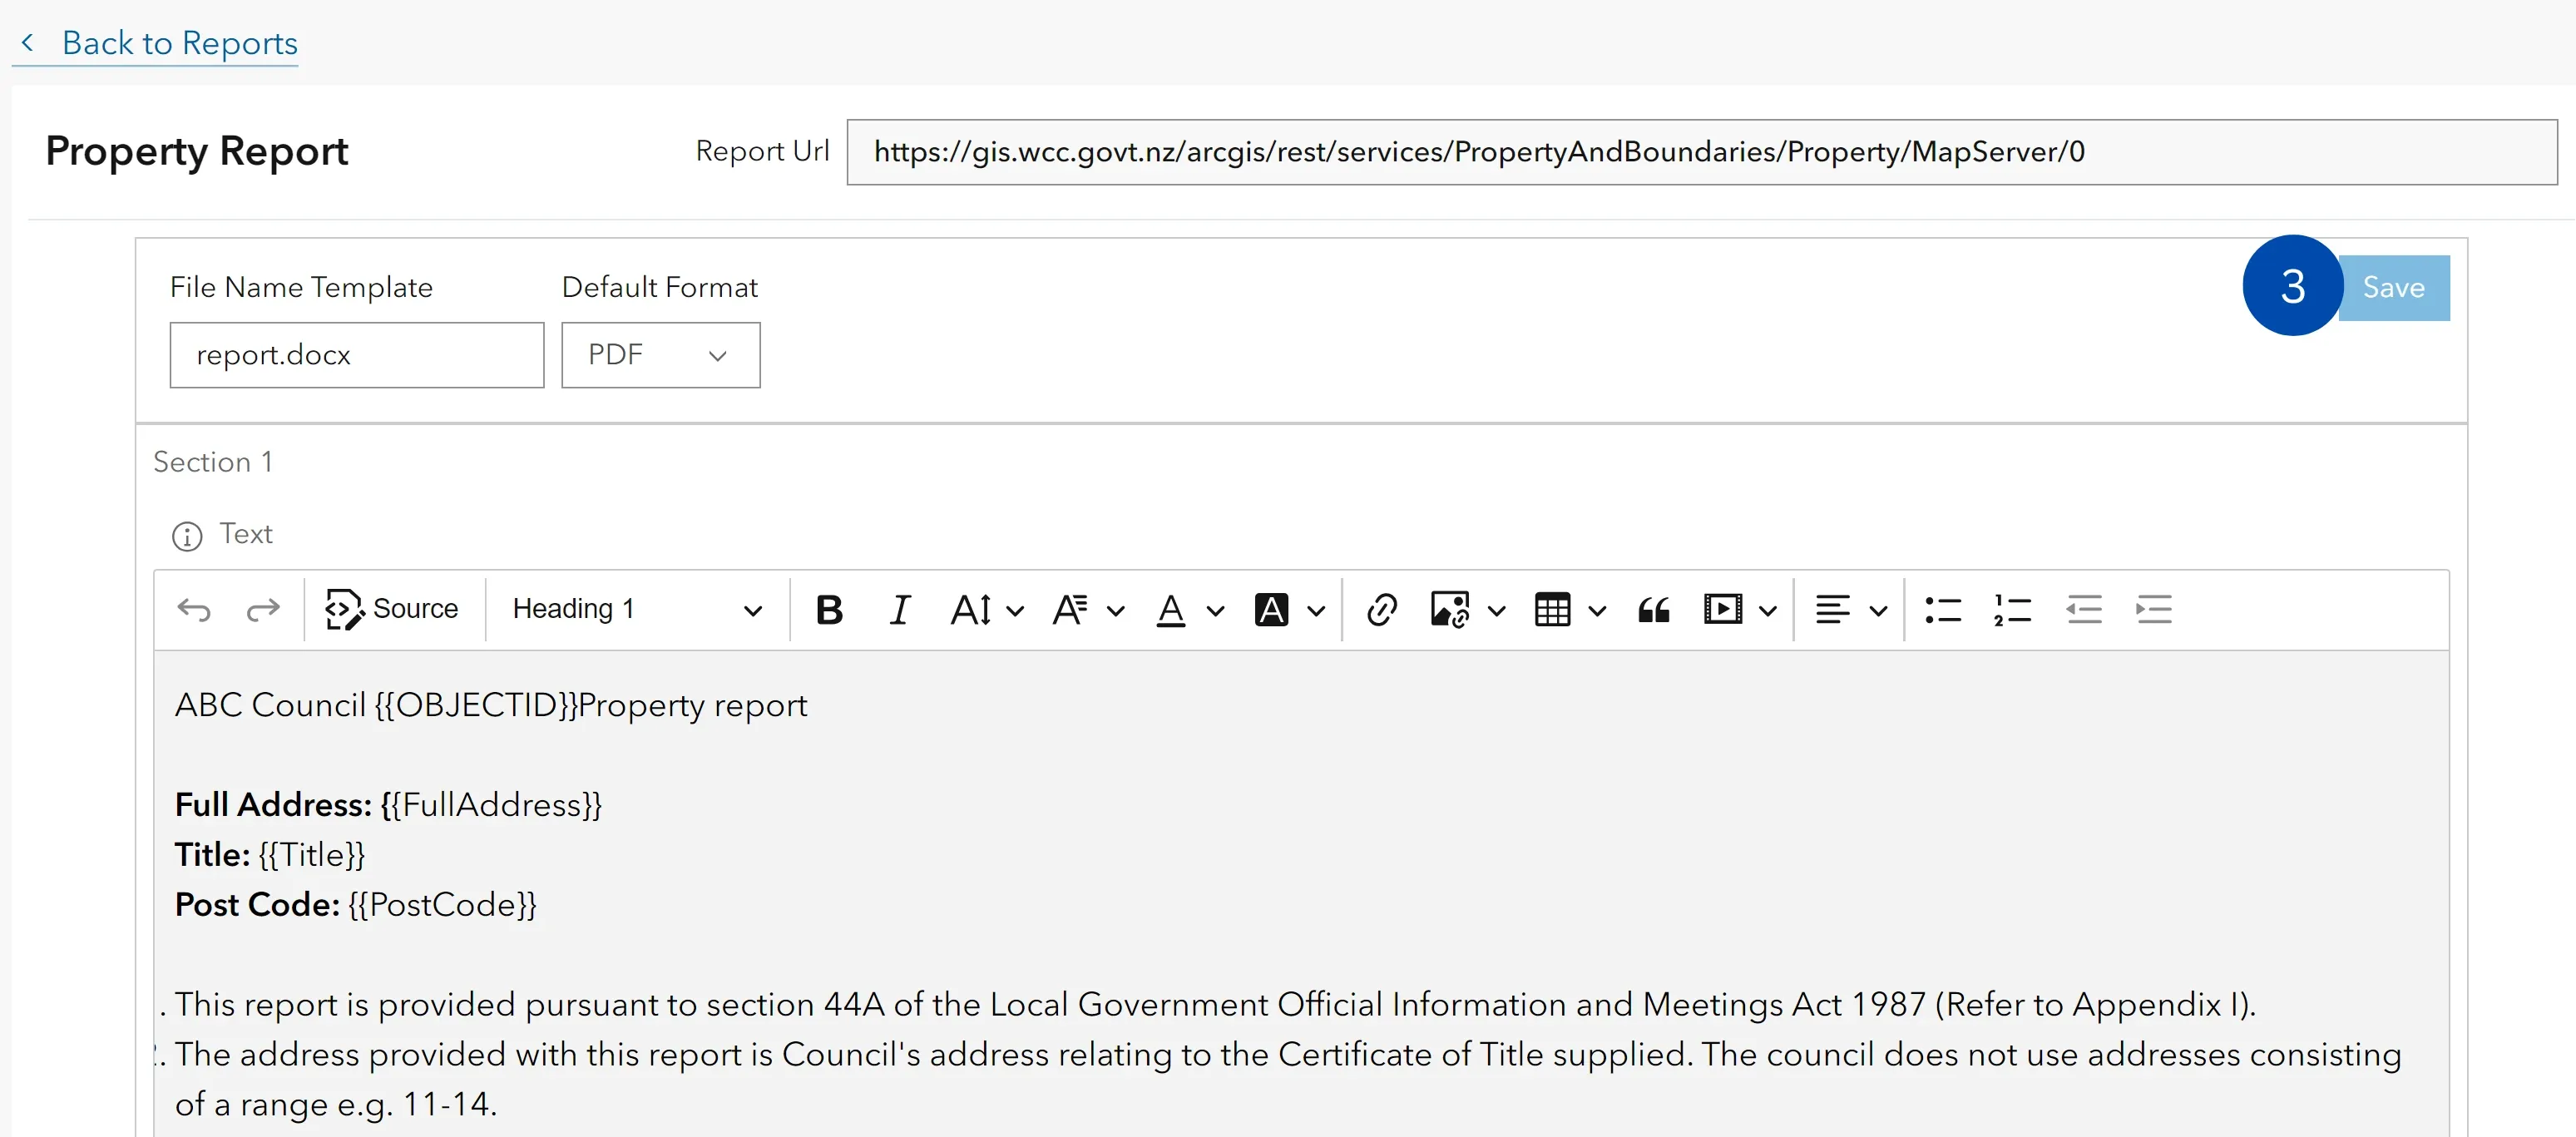
In the report configuration dialogue box, give a name to the report under the report name field. This name will be for the administrative reference.
-
Paste the feature layer service URL on which you want to base your report under Report layer field. e.g. Layer URL to paste - https://gis.wcc.govt.nz/arcgis/rest/services/PropertyAndBoundaries/Property/MapServer/0 Note: This layer should be available within the map where you want the report to be generated.
-
Click on Save to continue.
Configuring Output name and format
You can configure the output file name and the format through the options shown below.
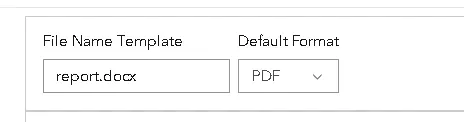
To enable dynamic naming based on the selected feature, include the field name with curly braces. E.g. {OBJECTID} report
Select a template for the section (available in 3.2 or above)
If you wish to use a template for this section, it can be selected from the dropdown list.
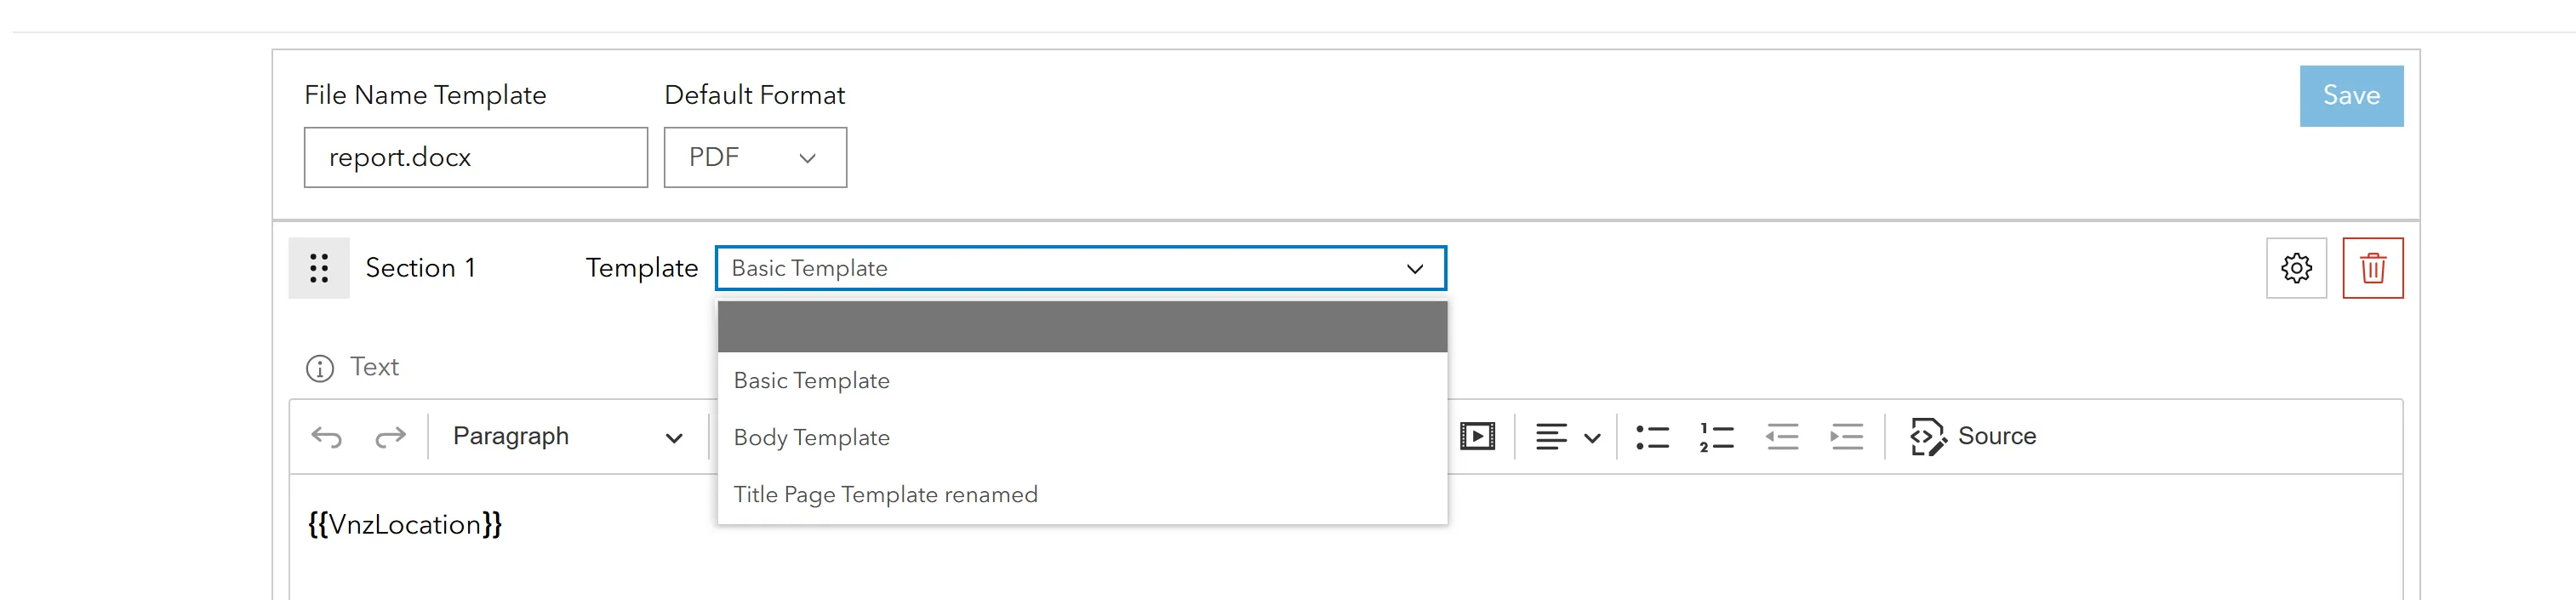
Tip: You are able to select different templates for each section. For e.g. a Front page of the report can have a specific template and the body can have a different template.
Adding Text
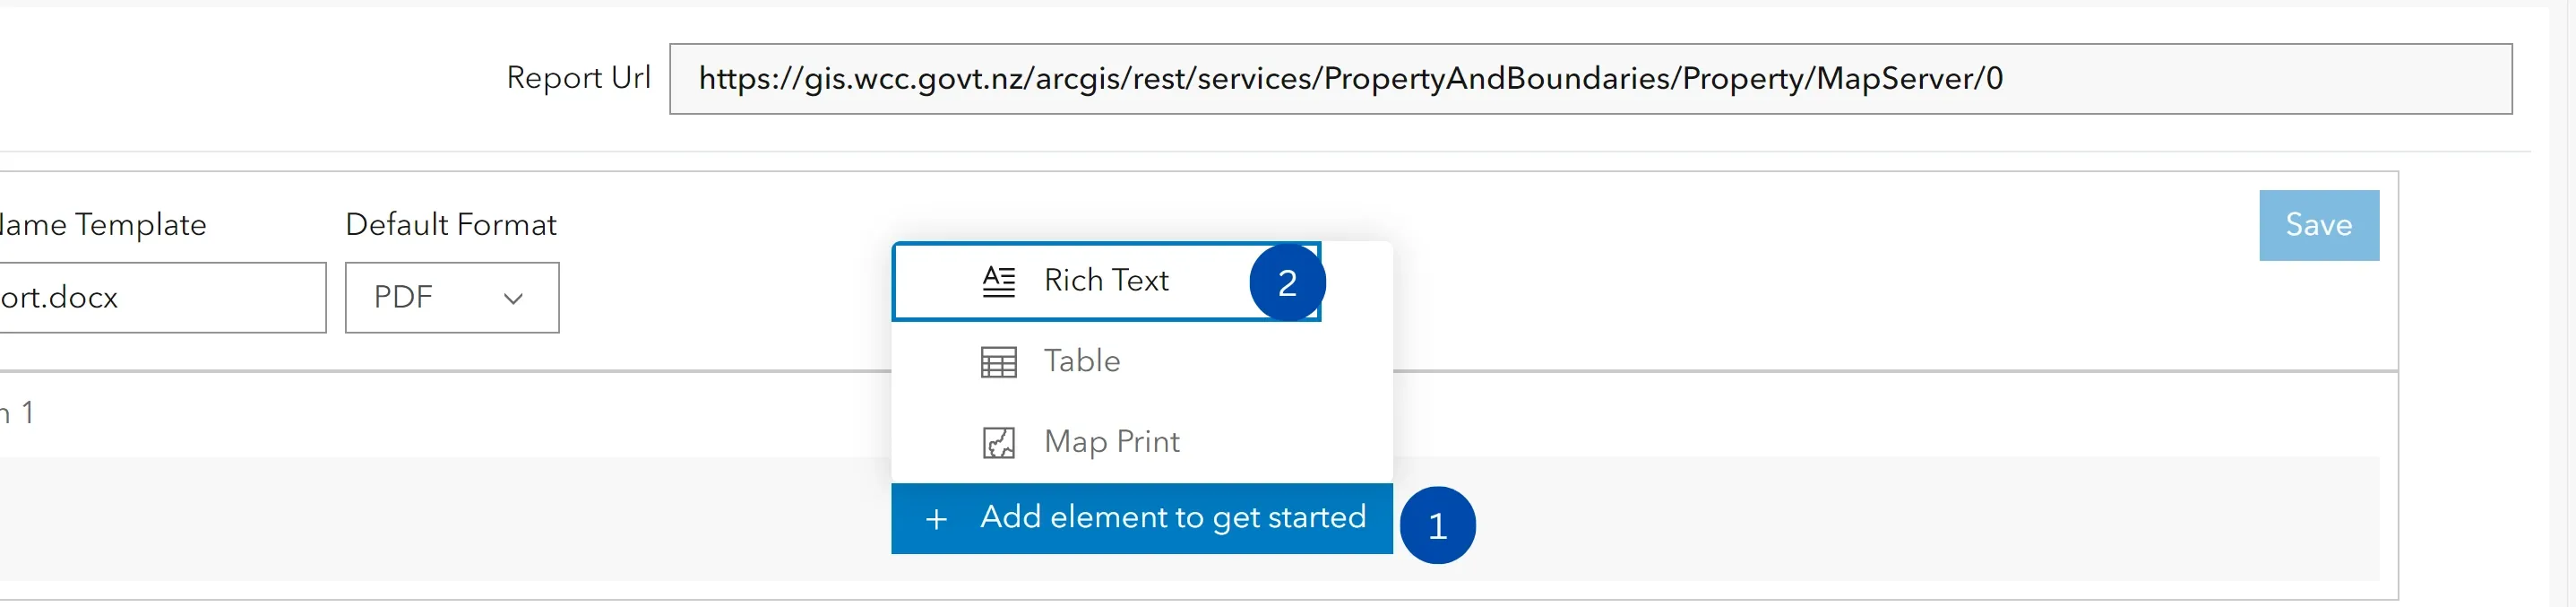
-
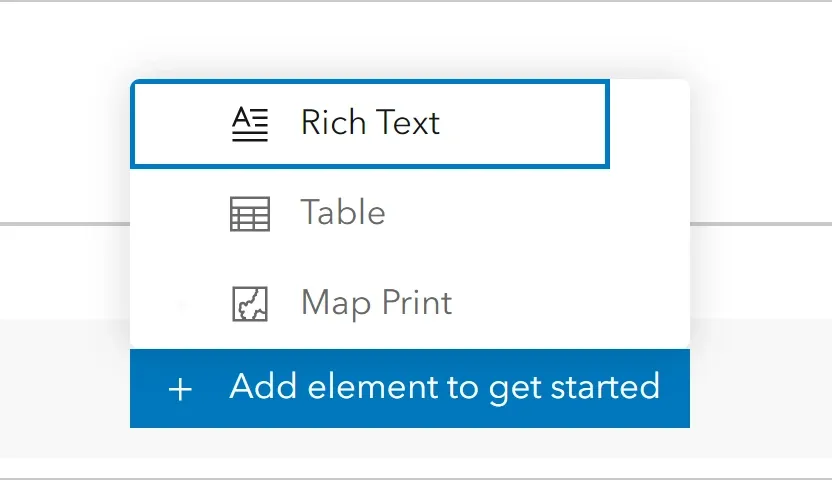
Click on Add Element to get started and select the Rich Text. This will open the report text formatting dialogue box.
-
Add text content as required. You can format the text as Headings, paragraph as needed along with font formatting options.
Note: You can include the data from the layer you have based your report on. For this, add the datapoint between two curly brackets
In the example given below, the Datapoint to include is ObjectID, FullAddress and Title. So, the syntax to use is(“{{“,”}}”). While generating reports, this gets replaced with the data according to the feature on which the report is generated on the map.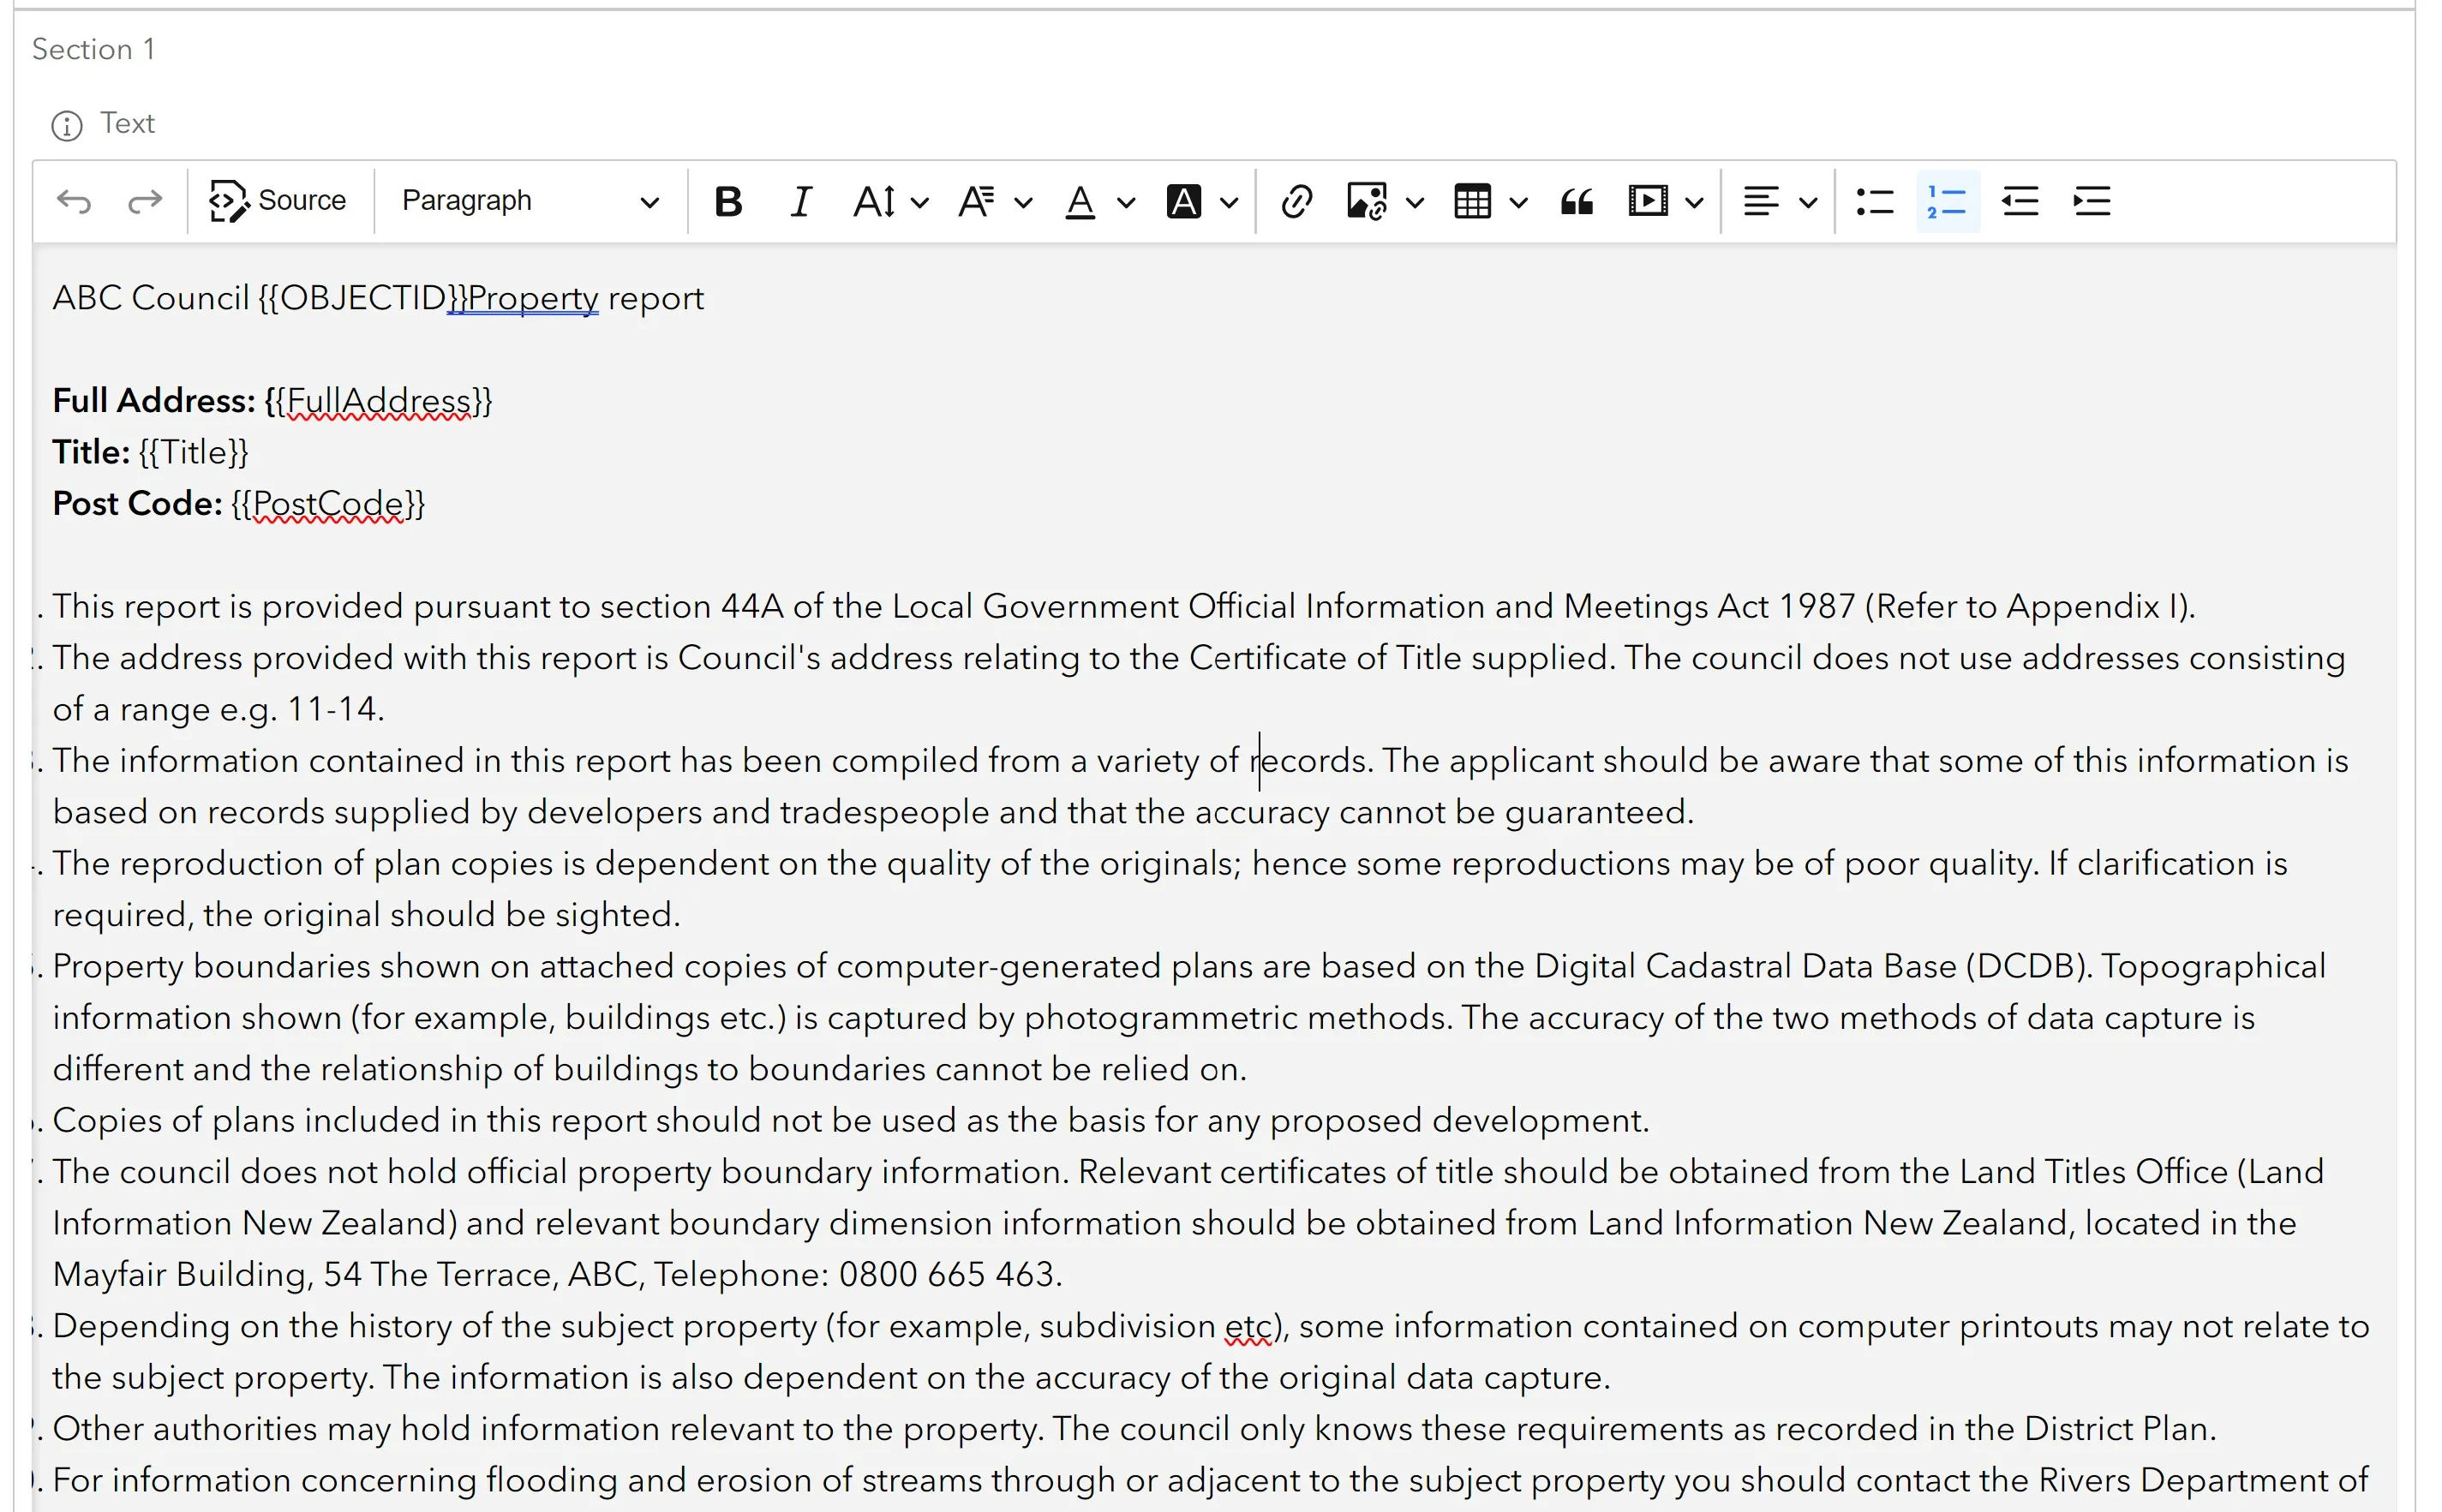
{{ObjectID}}, {{FullAddress}}, {{Title}}. The wording should match exactly how it is configured in the feature layer.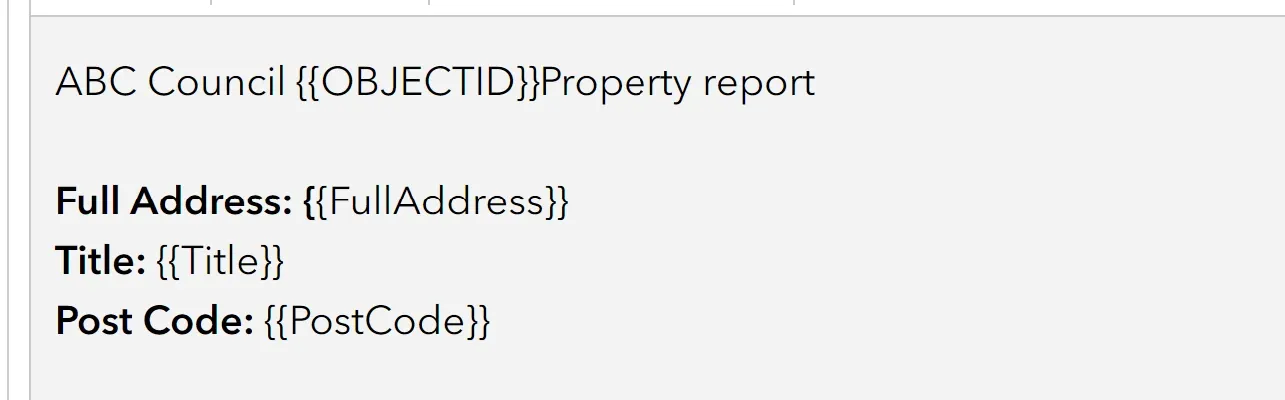
-
Once the content is added, click on save to continue. Now the report is created and saved.
-
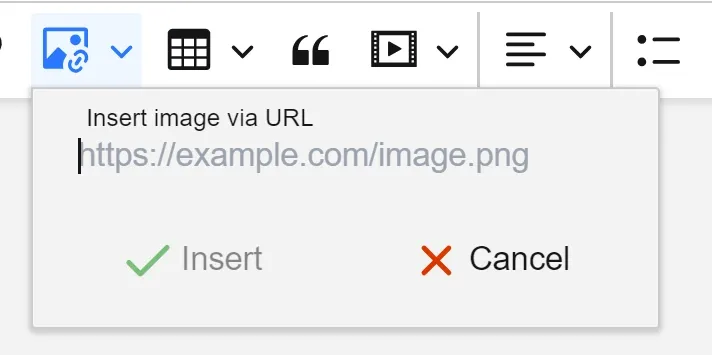
You can include any images available online by clicking on the ‘Insert image via URL’ option and adding the image URL.
Adding Map print to the report
It is a requirement that the web map must be shared publicly for this step.
-
Click on Add Element to get started and select the Map Print element. This will add the map layout dialogue box in which you can configure the map print.
-
You can configure the map that should appear in your report and how the output should be i.e. Scale, inline or in a new page along with dimensions.
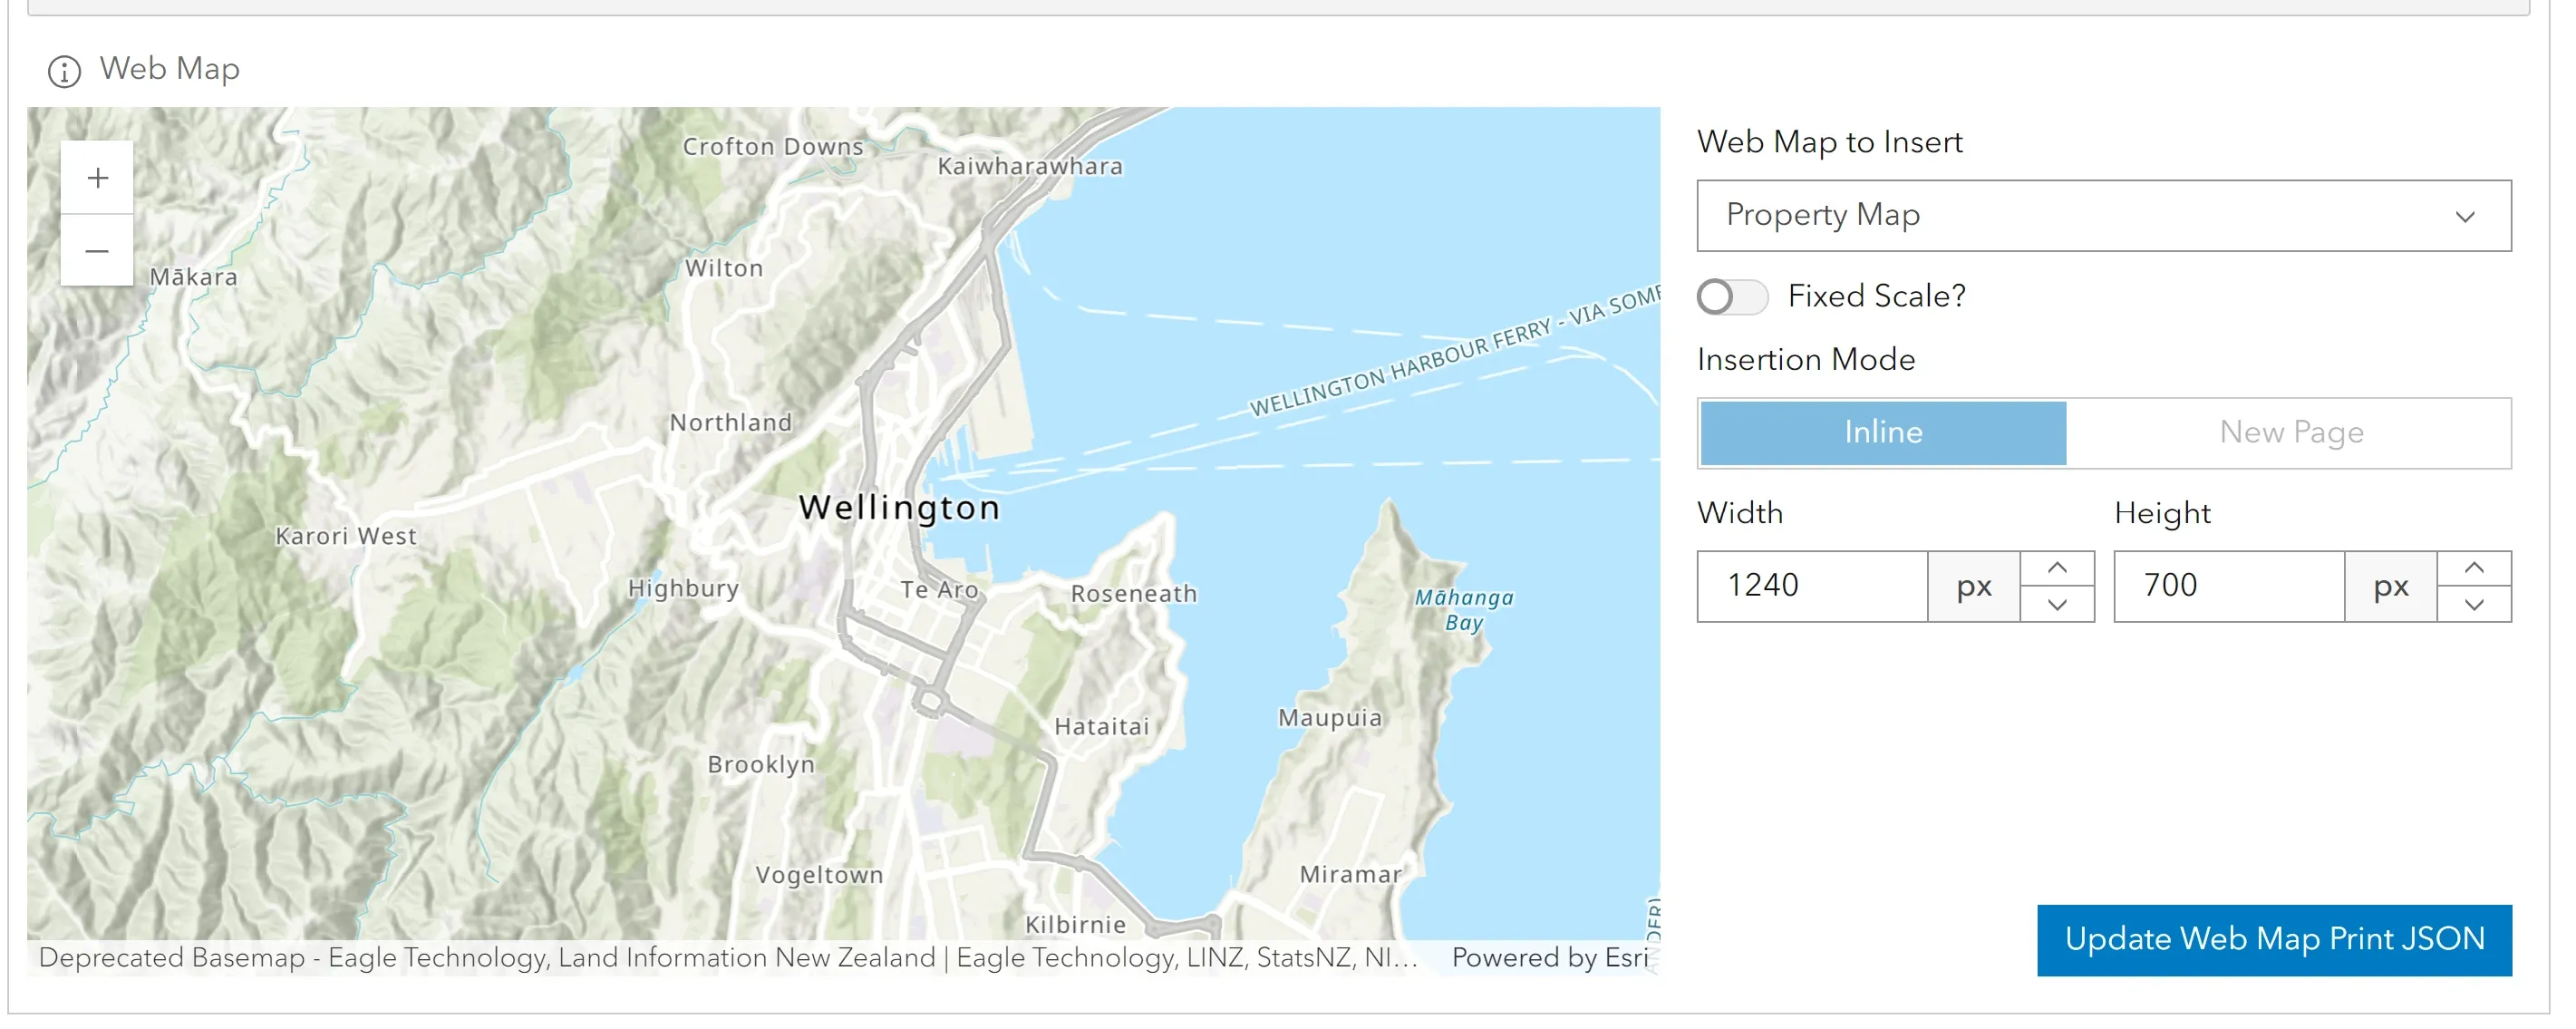
-
Once the map element is added, click on save to continue. Now the report has map element included and saved.
Note: If you make any changes to the map print element, you need to save the changes manually by clicking on ‘Update web map print JSON’.
Full-page map: (available from v3.2 and above)
-
A full page map can be added to a separate page. This can be done by toggling the insertion mode to New page.
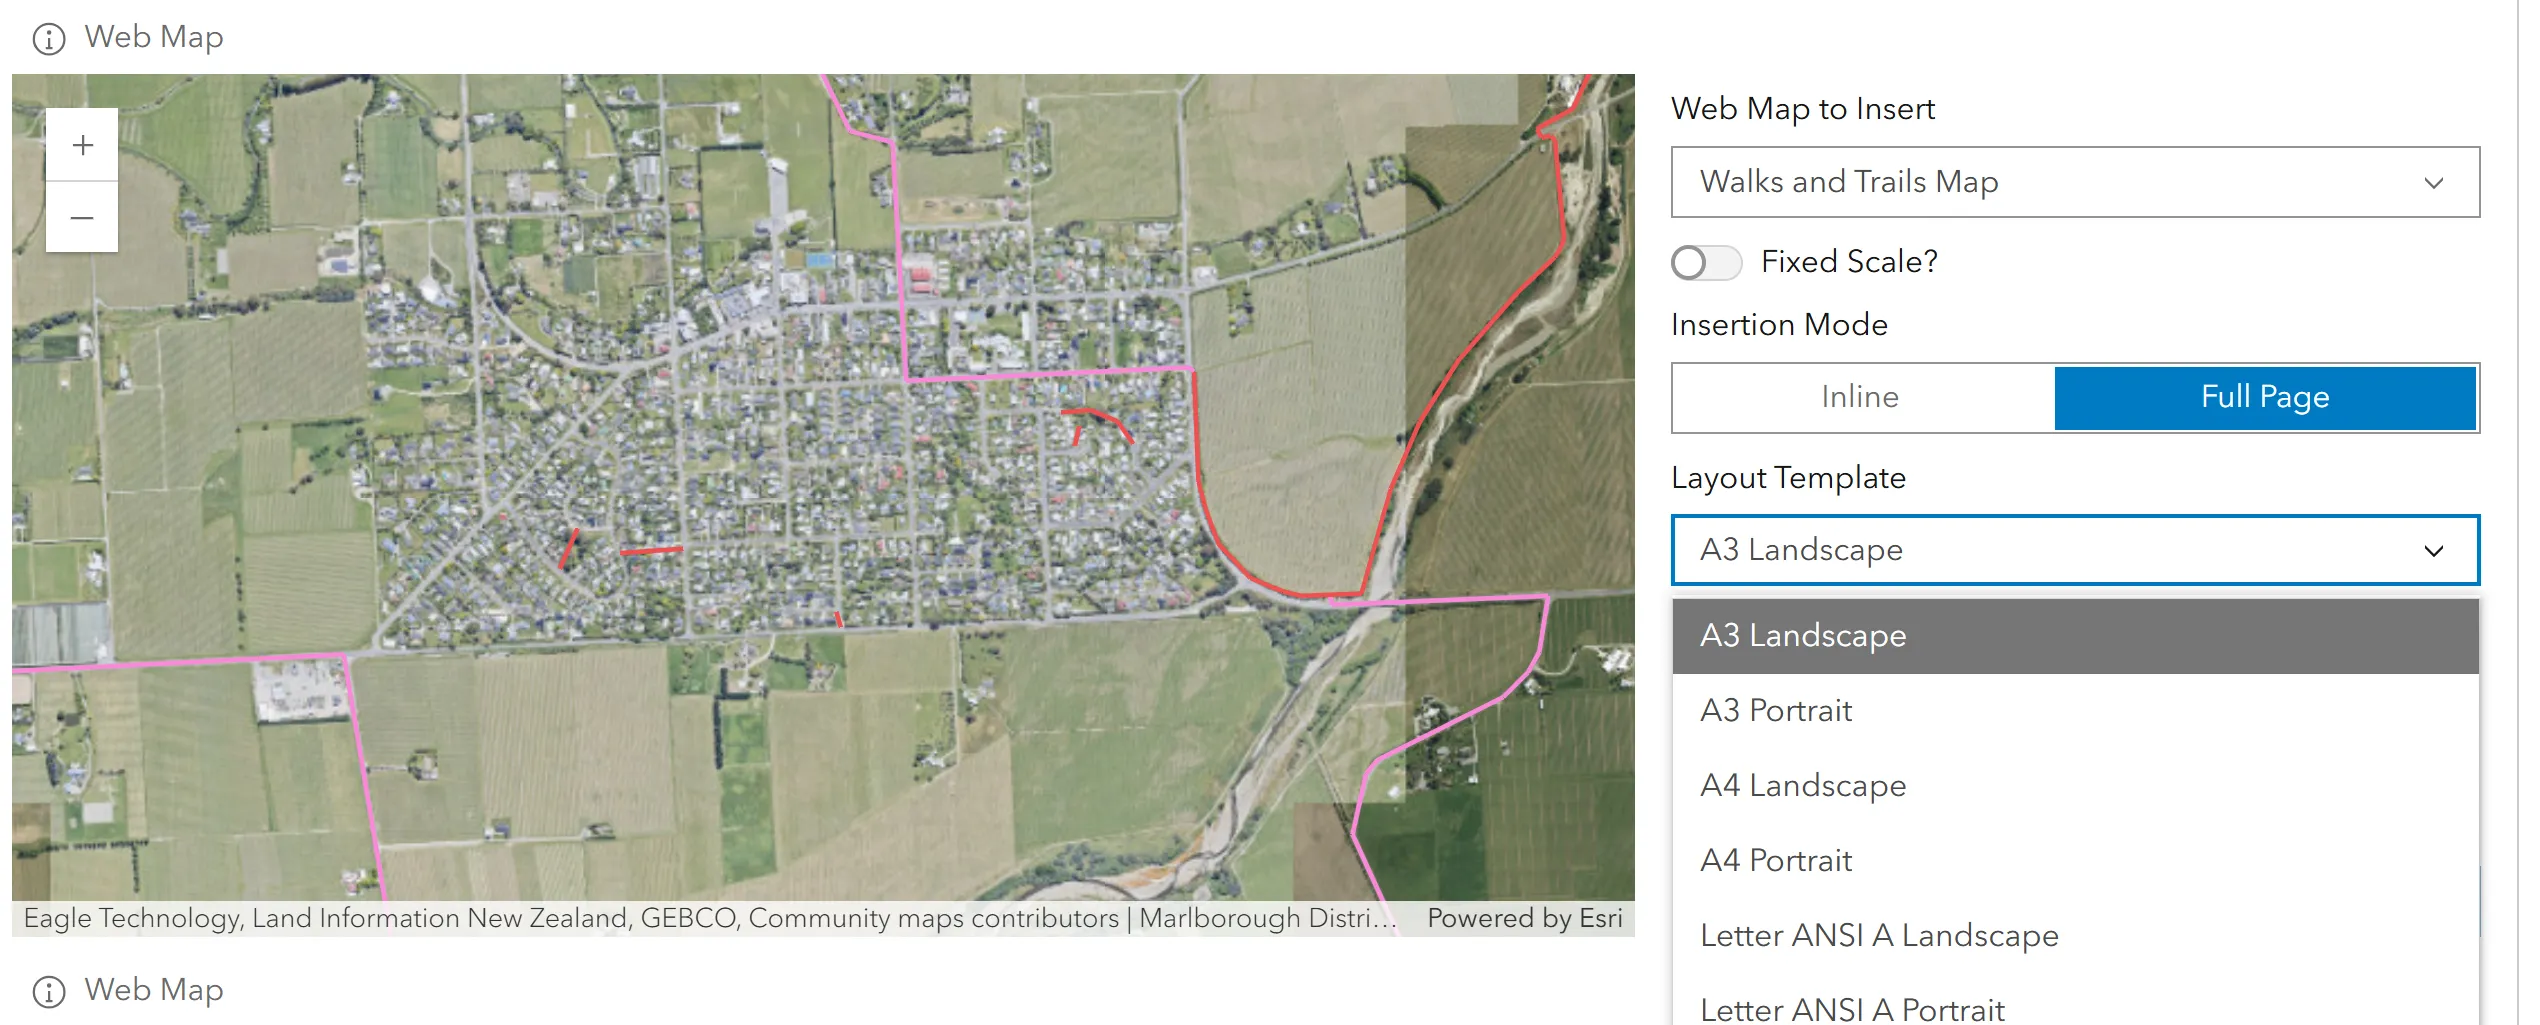
-
Select the layout template you want for the output map prints. These templates are fetched from the print services set up in the Report settings.
Adding Table to the report
-
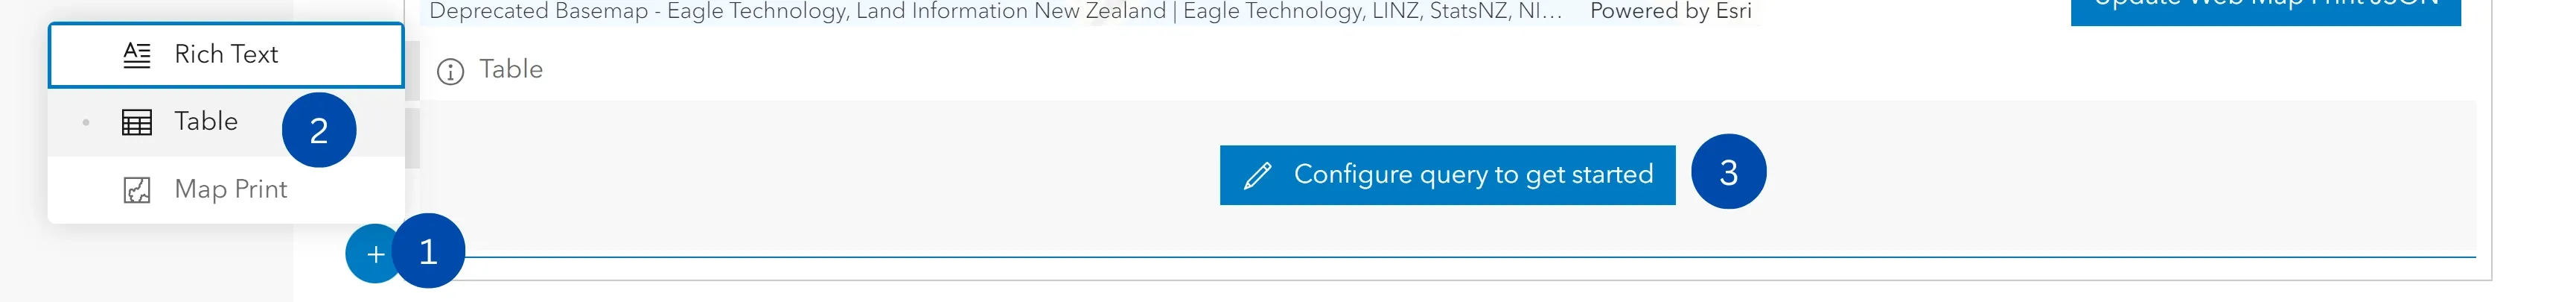
Click on Add Element to get started.
-
Select the Table element. This will open the table formatting dialogue box in which you can configure queries.
-
Click on Configure queries to get started.
-
In the Layer query dialogue box, give a unique name to the query.
-
Select the query layers from your content, i.e. from Portal or ArcGIS online or your connected data sources. Note: As of version 3.2.6 the free text field for layers has been removed
-
Or alternatively, input the service URL that you would like to query against. When you select it, it will auto-populate the Currently Selected Query Layer field.
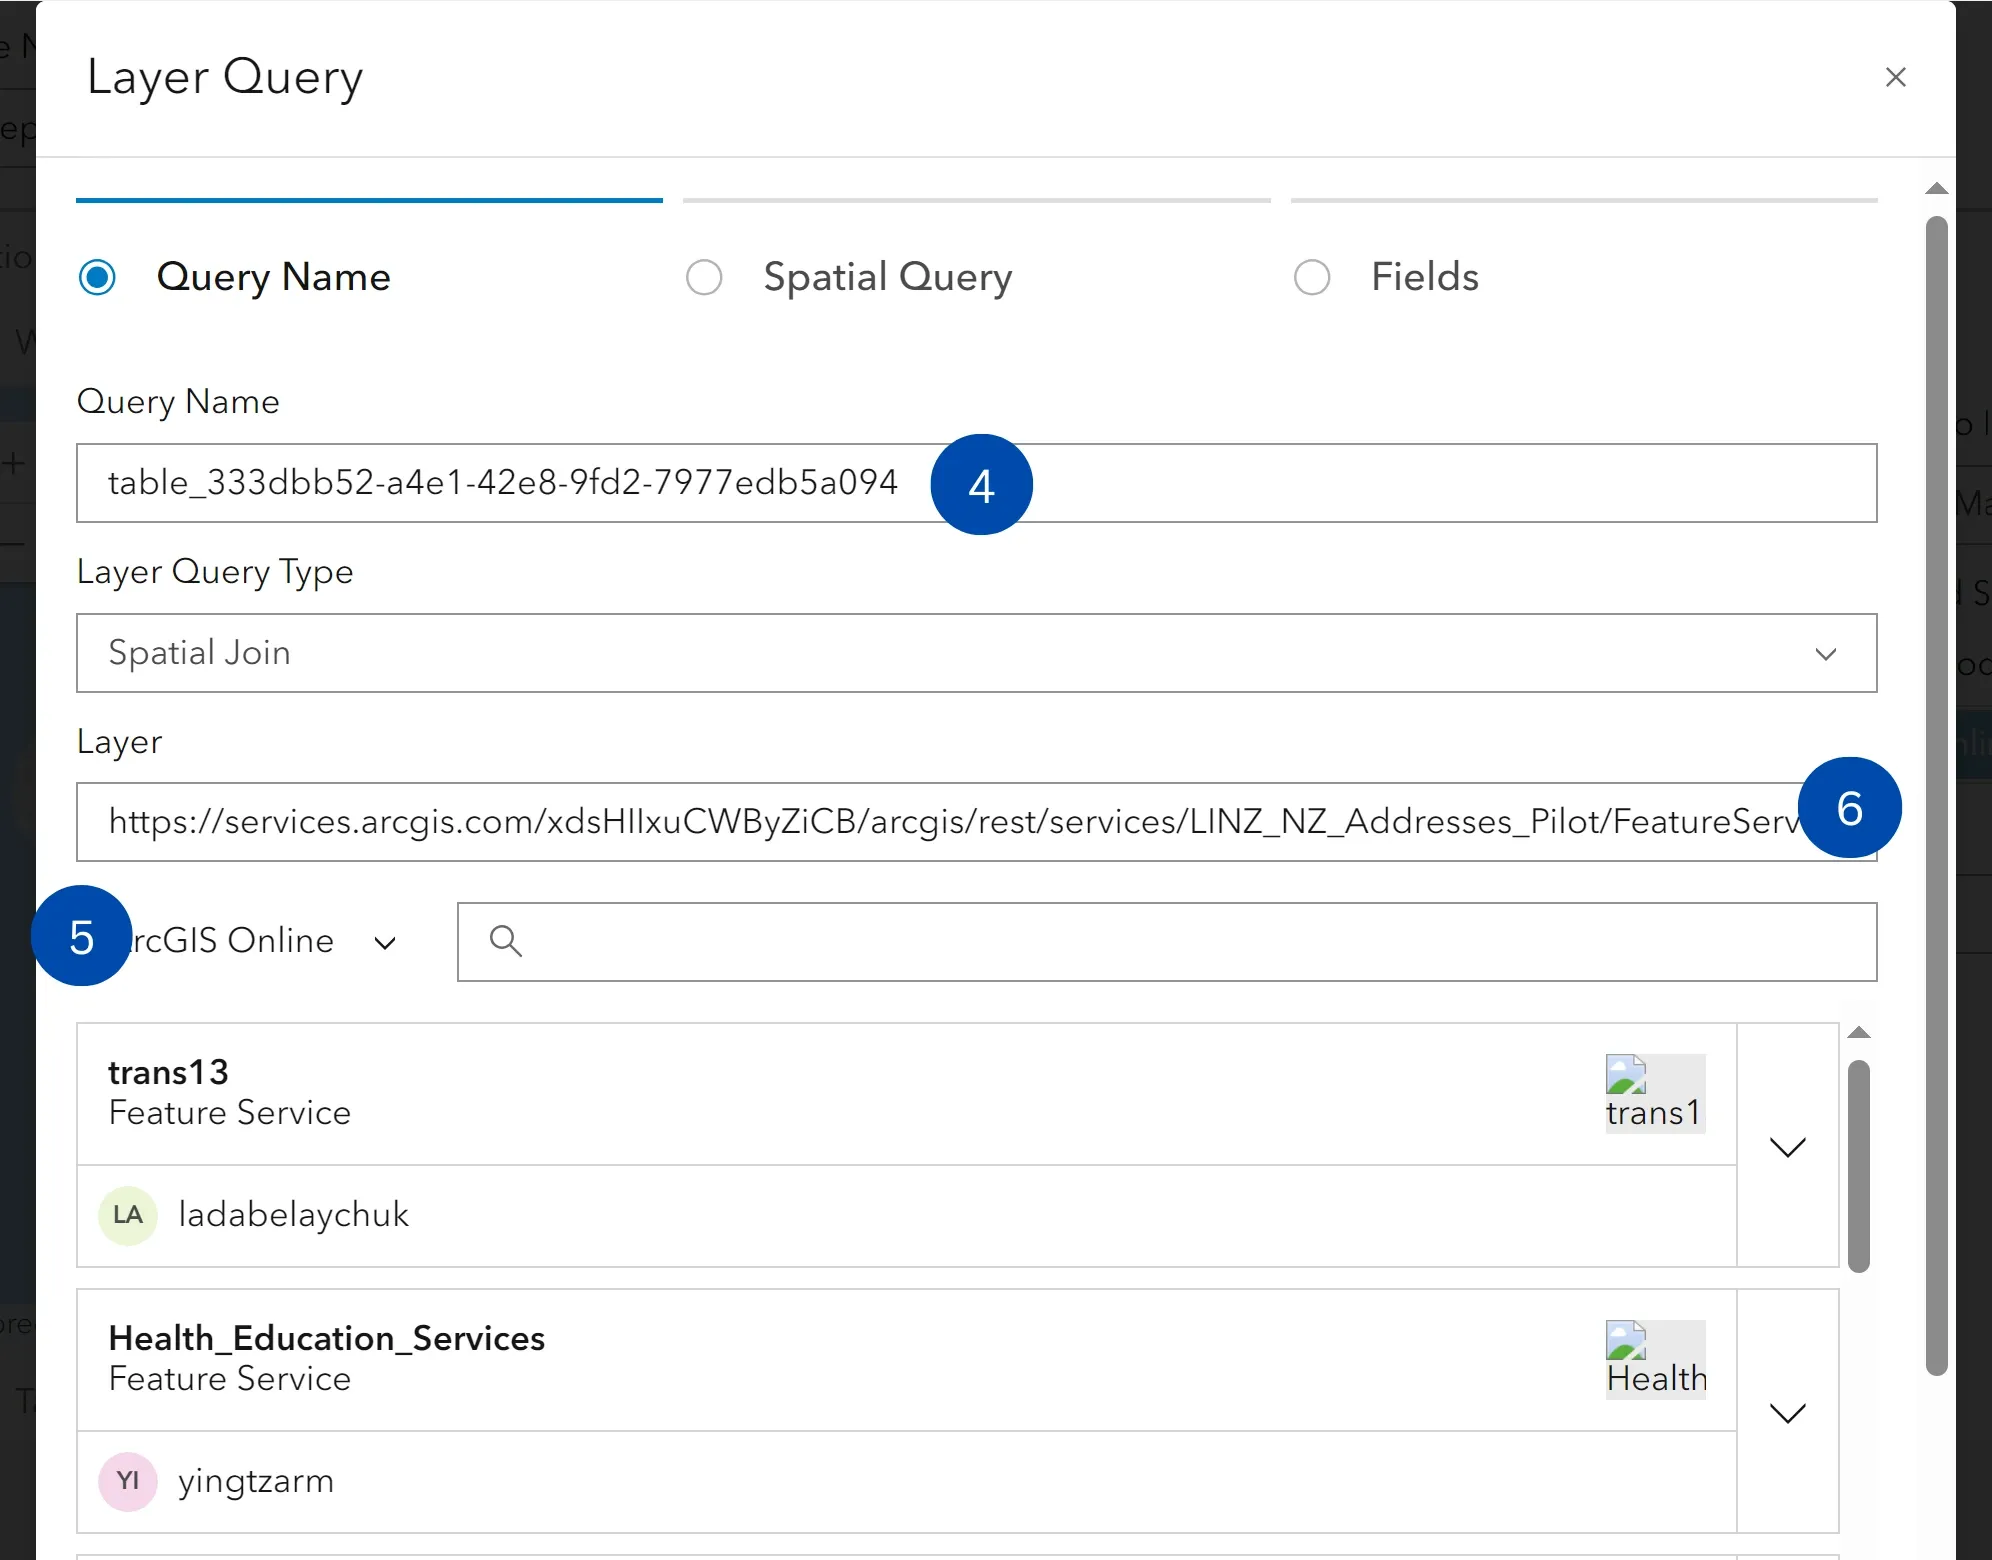
-
Select the type of join you want i.e. Spatial join or Table join.
a. Spatial Join allows you to pull information based on the interaction. i.e. Contains, intersect, overlaps or within.b. Table Join allows you to pull information based on the criteria setup in the Where clause i.e. Equals, not equals. Example below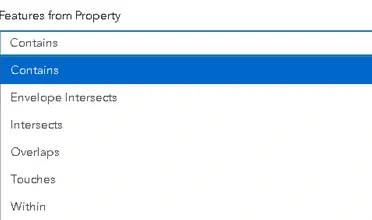
Spatial Join
-
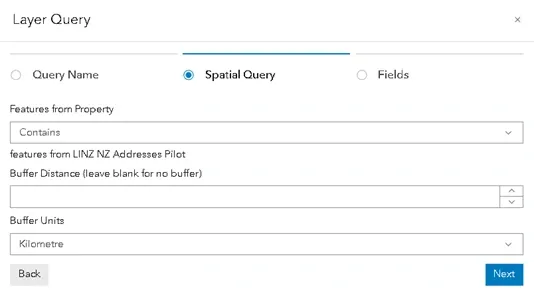
If Spatial join is selected, select the feature interaction, buffer distance and units and click next.
-
Select the fields that needs to be displayed in the output file and click submit to complete adding the table element.
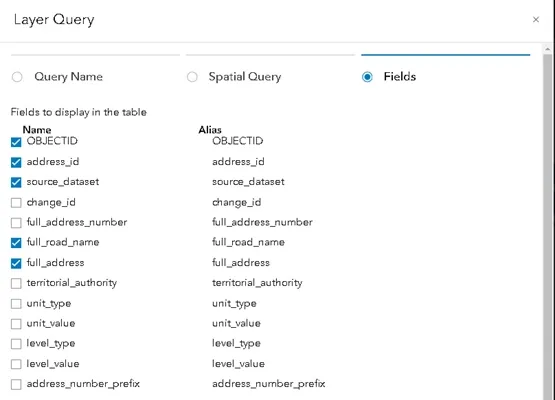
Table Join
-
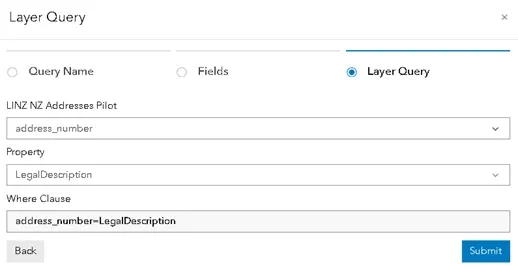
If Table join is selected, Select the fields that needs to be displayed in the output file and click next.
-
Select the field you want to match from the target source and the field to match from the existing layer in the web map. After this, select the appropriate clause and click submit.
Once the elements are added, report can be added to the map and generated.
Create conditional sections (available from v3.2 and above)
Conditional sections in Reports are now available from v3.2. Conditional sections allow you to bring together multiple tables, text elements and map prints into one comprehensive report based on spatial queries or conditions you have defined.
For example, you may have several sections, such as a Property Information, Utilities and Flood Hazard amps which you wish to combine into a single report. However, you only wish for a specific section to be included in the report if it is relevant to the selected parcel. This will be interrogated based on a Layer query. e.g. If the selected parcel intersects with a flood hazard layer, include the Flood Hazard report. If it does not, then this section won’t appear in the reports.
-
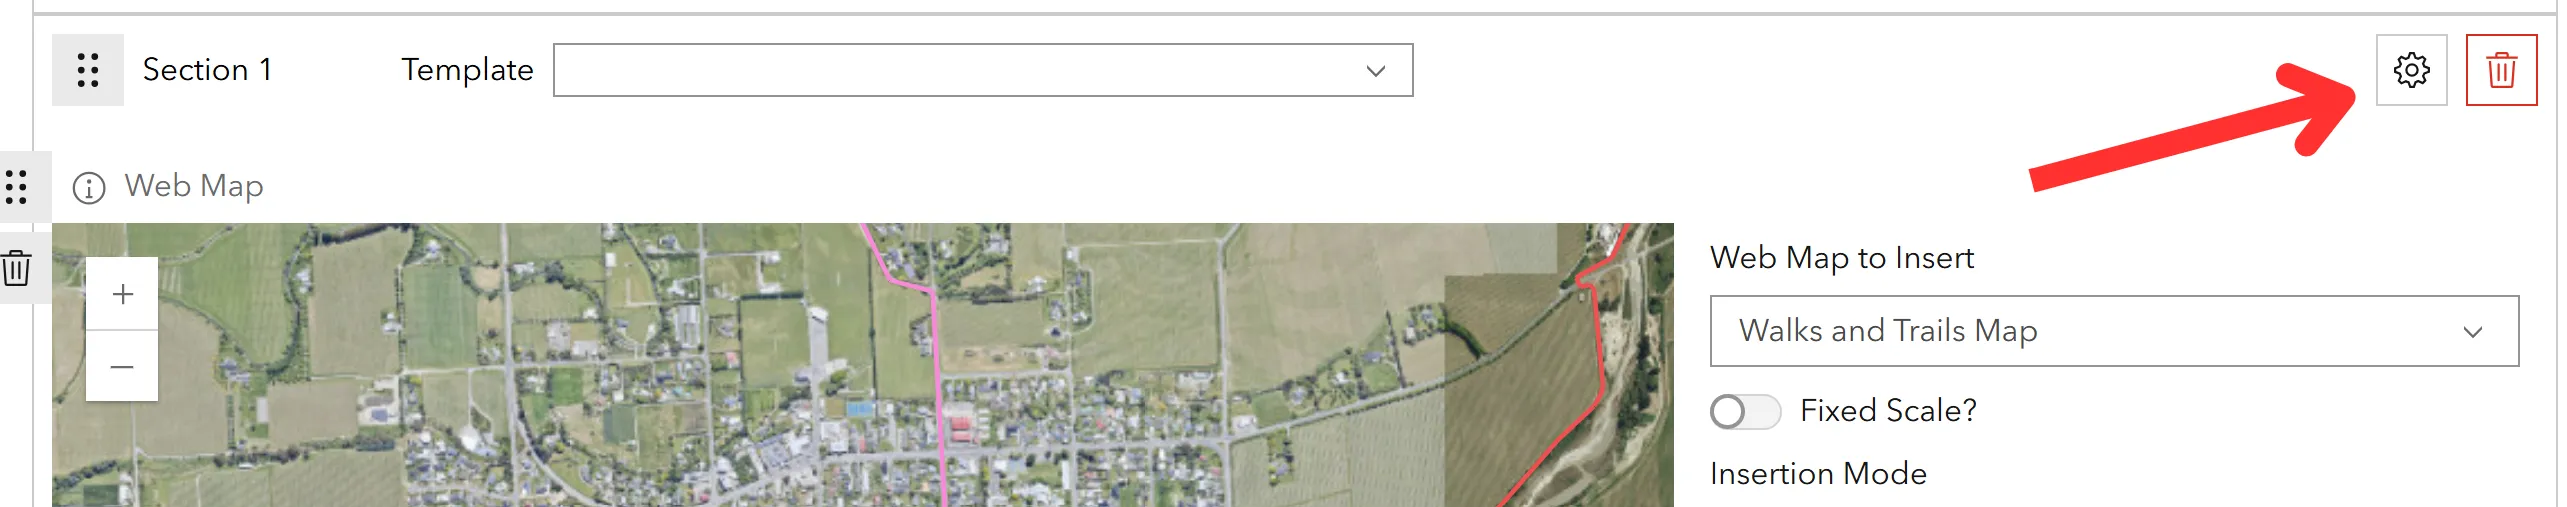
To add a condition to a section, click on the little cog icon placed on top right of the section header. Then click on the Add Conditional button in the following dialogue box.
-
Select the layer from the ArcGIS sources or a data source from the dropdown. This will depend on the conditions you may want to set. Click next to continue.

Note: If you are planning to use only field conditions (e.g. Location = Greytown), the layer must be the same as the report layer. In such case, copy the layer URL from report settings and paste it here.
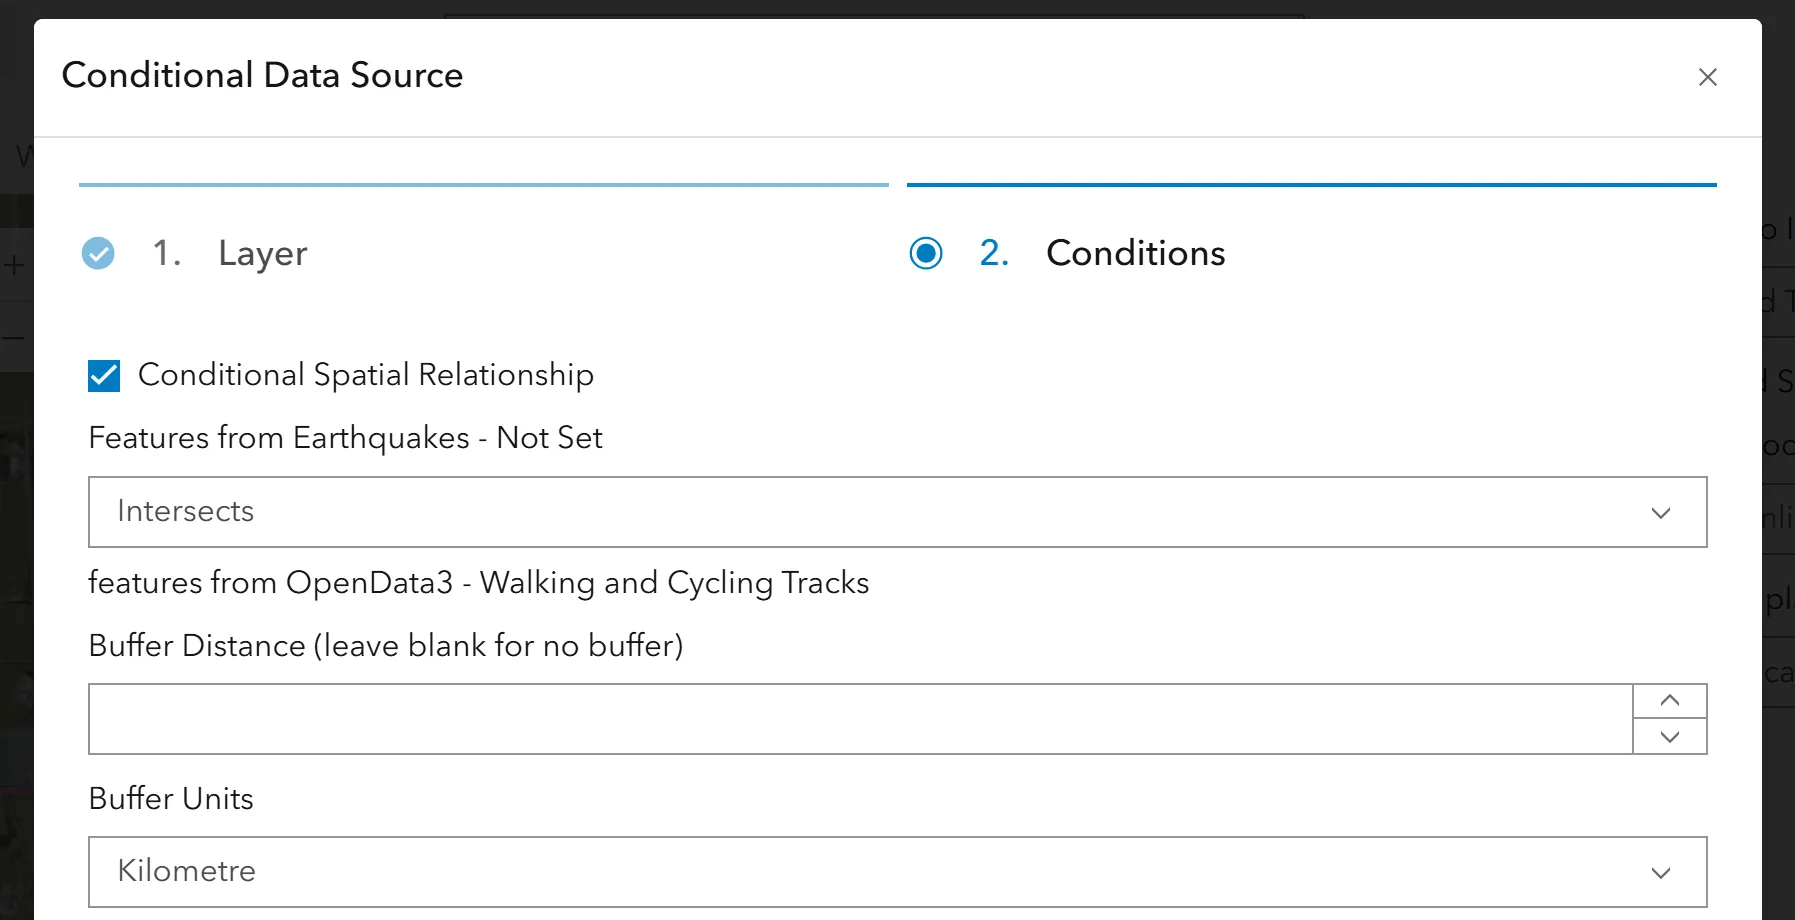
Adding a spatial condition to a section
- Spatial conditions can be set based on the requirements. This means that if this condition is met, this particular section will appear in the report.
- Buffer can be added as well, along with setting the units that works.
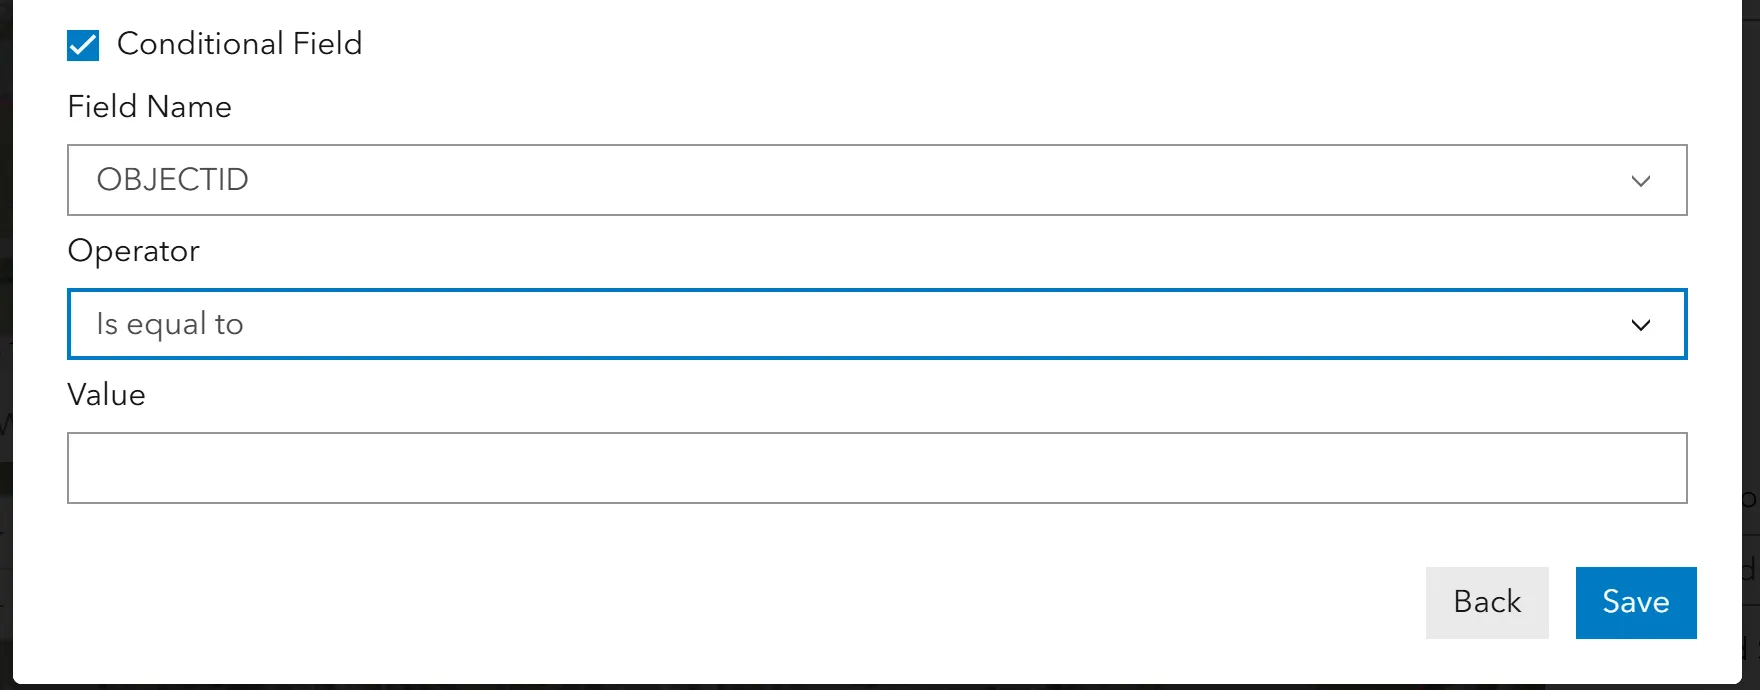
Adding a conditional field to a section
- Conditional fields allow you to configure criteria with a value. If the criteria are met, then the section will appear. The criteria can be ‘equals’, ‘greater than’, ‘lesser than’, ‘greater than or equal to’, ‘lesser than’ or equal to’ and ‘not equal to’ to the value given.
- You are allowed to set multiple conditions for one section. Also, you can setup both conditional and spatial conditions together as required.
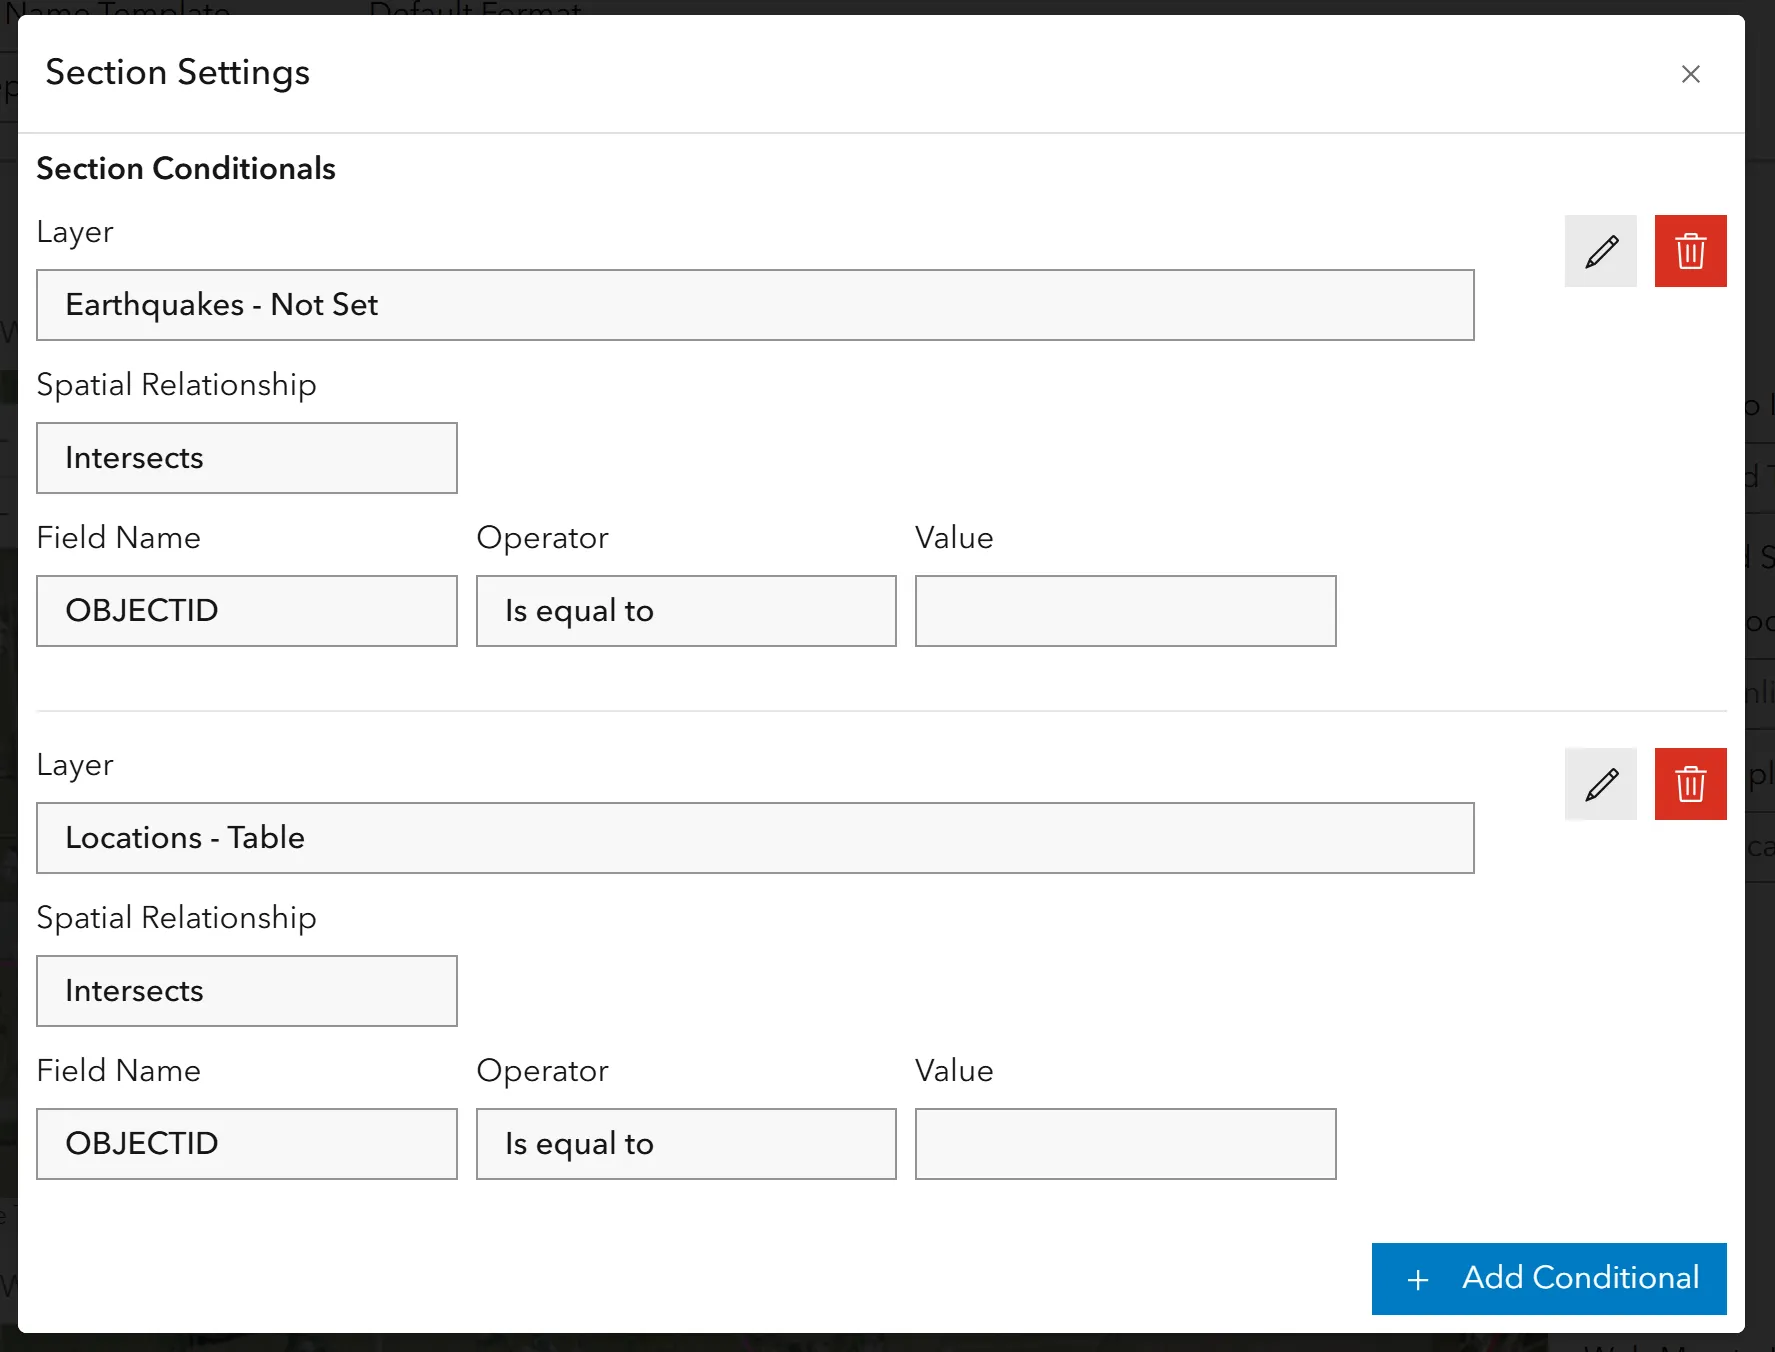
- The conditions can be modified later or can be removed as well. Note that this will only modify the conditions set for those sections.
Add a report to the map
-
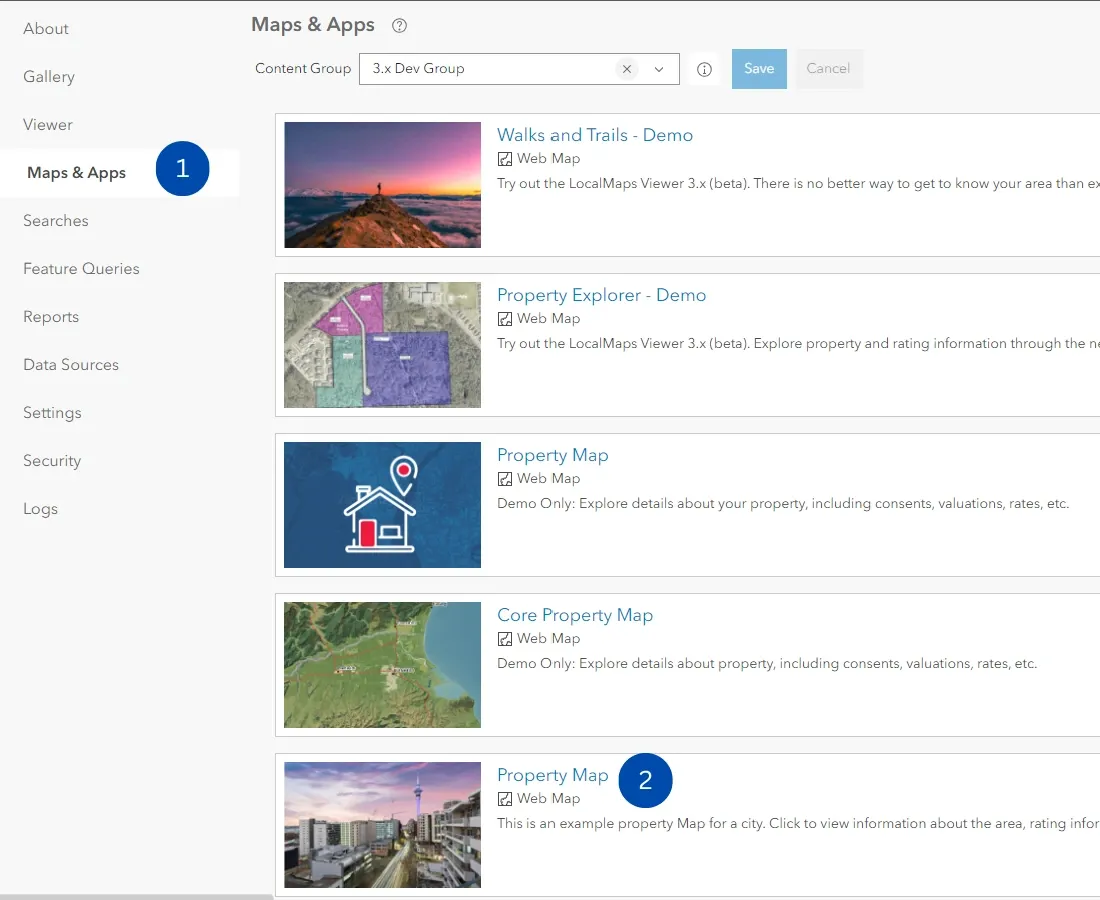
Click on the Maps and Apps on the left tab in the administration panel.
-
Select the map where you want the users to generate this report. Please note this map should have the layer used to create the report.
-
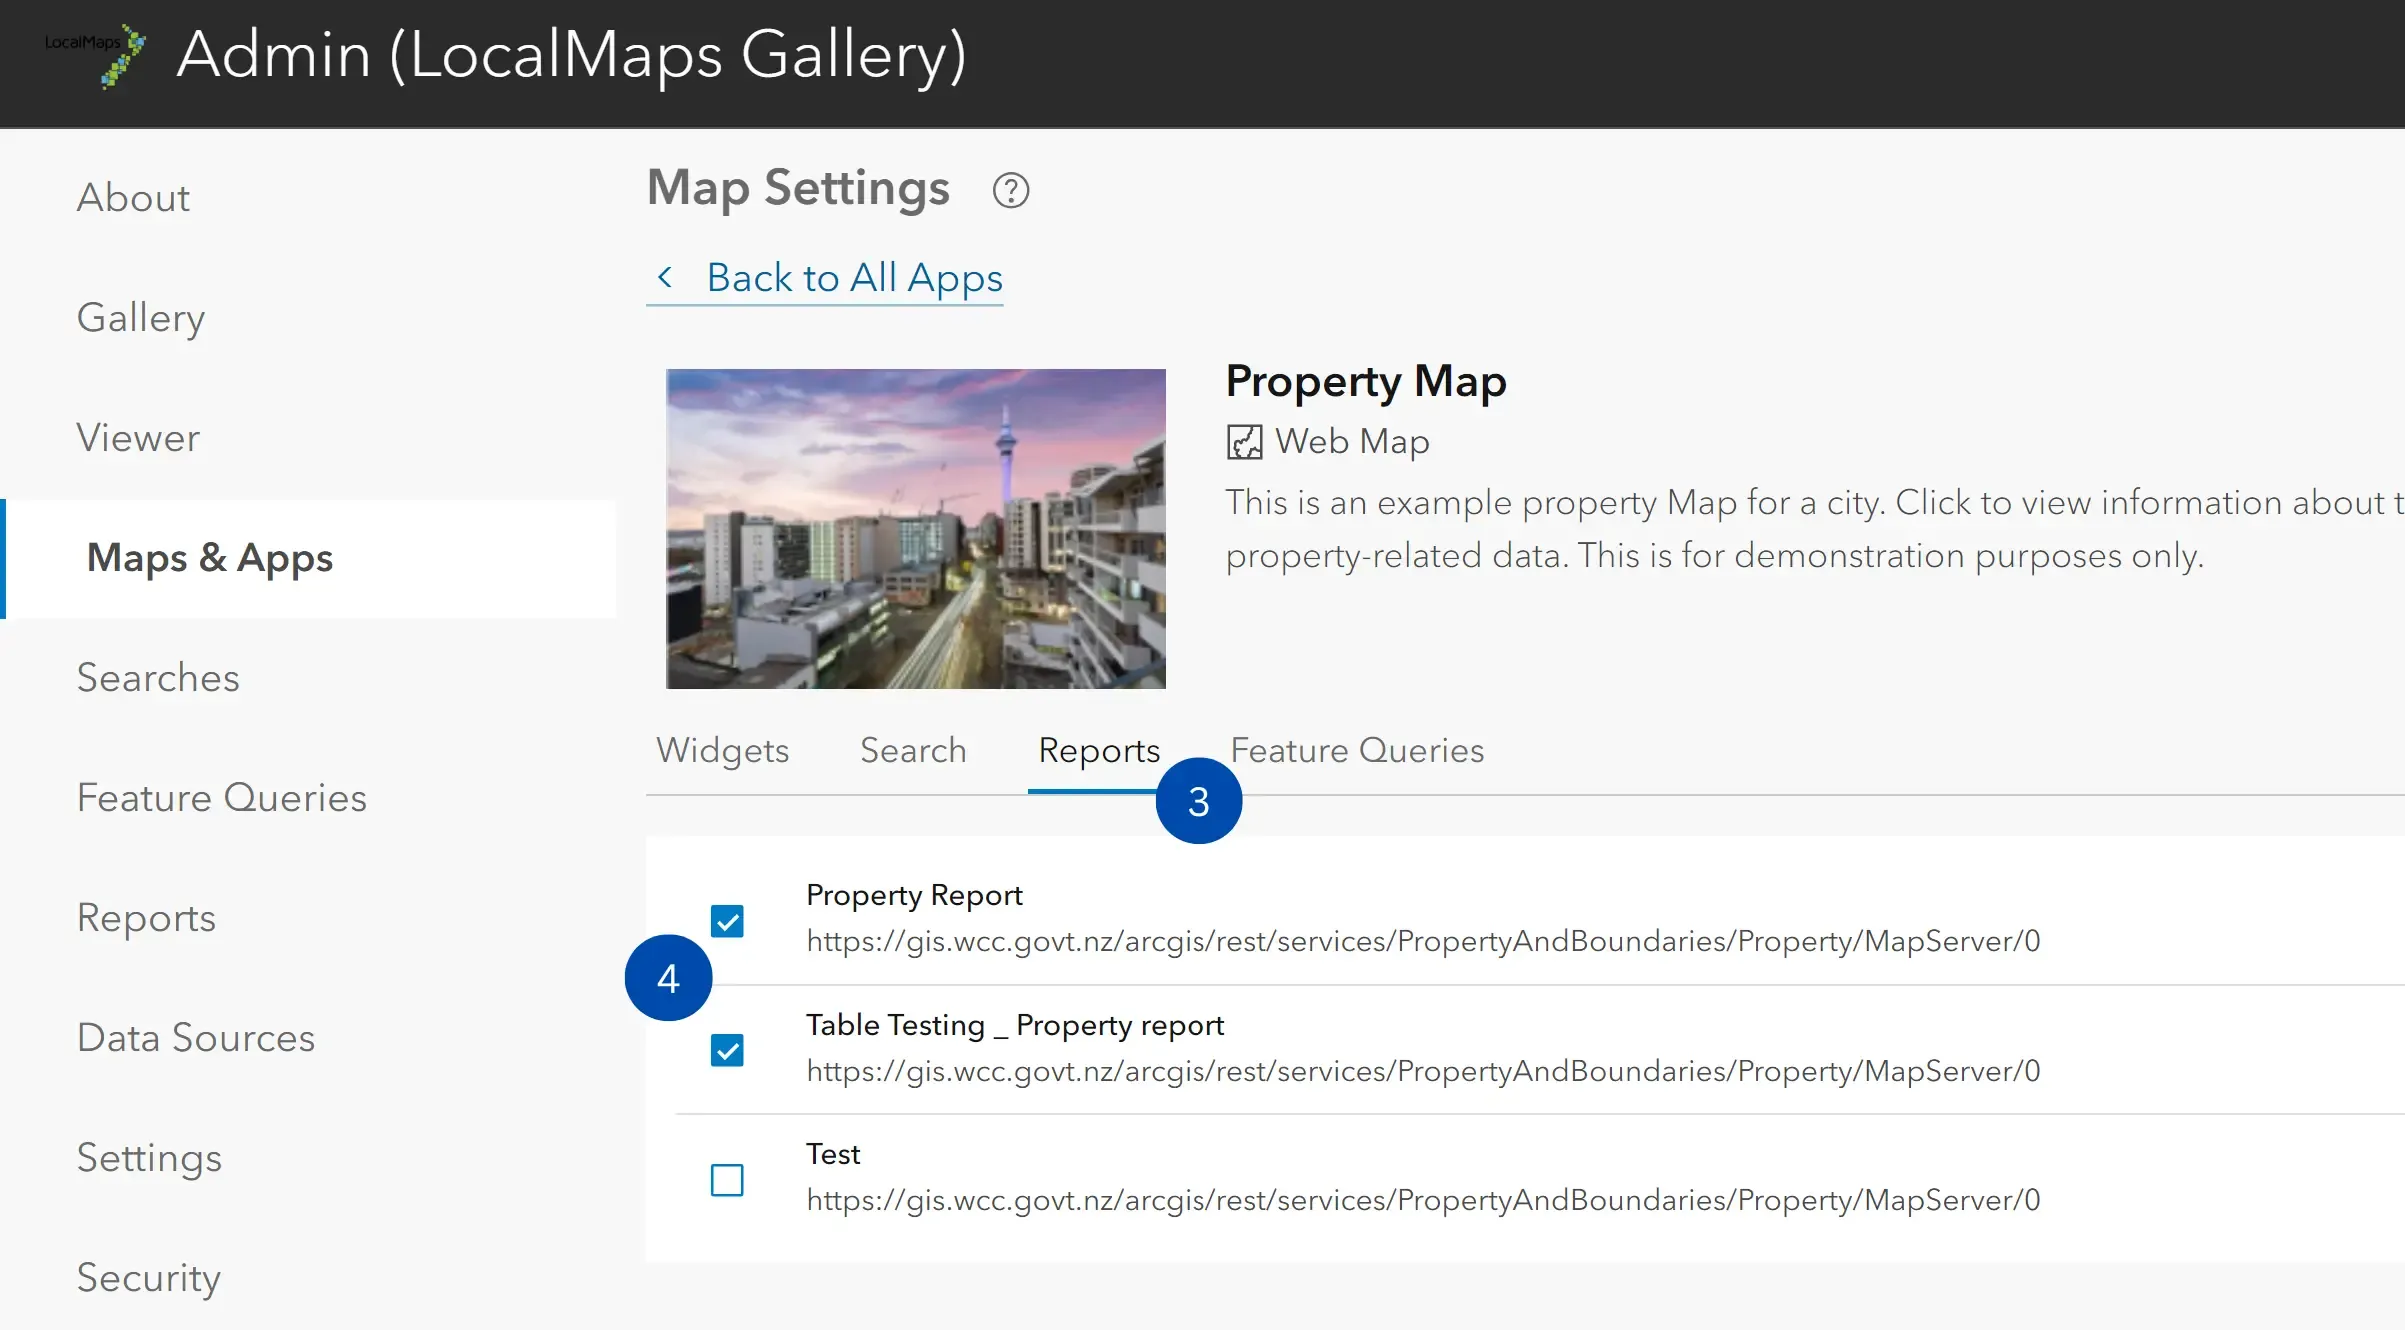
Click on the reports tab to view the reports that can be enabled on that map.
-
Select the report and enable it. You will get a confirmation message on the bottom right when the map settings are updated.
Generate Report
-
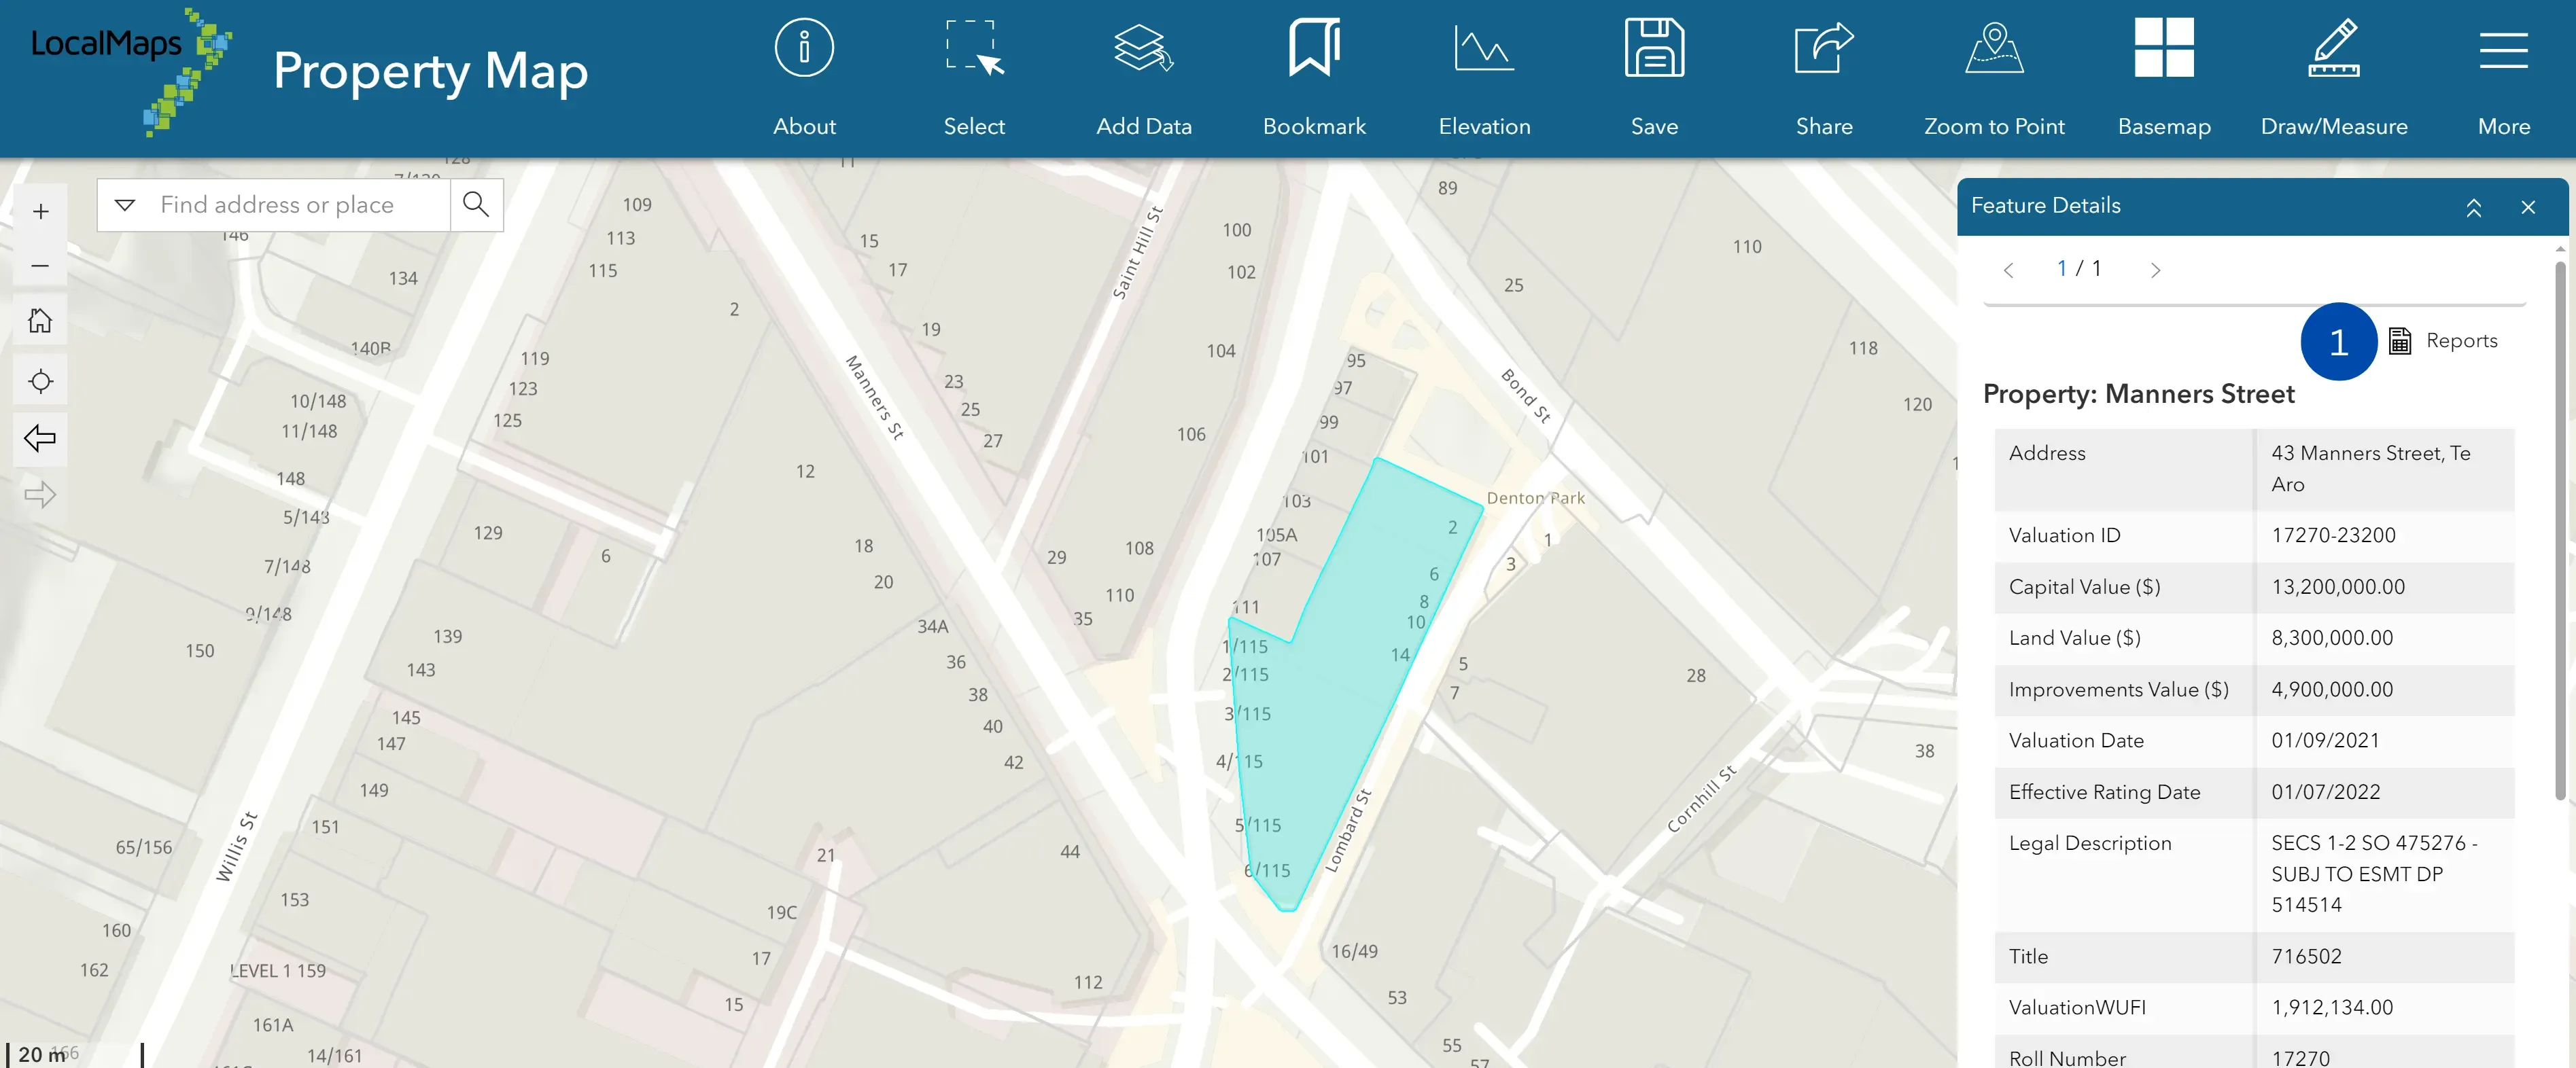
Open the map and click on a feature from the layer. The pop-up opens with the information associated. If the map has reports configured, you will be able to see the Reports icon on the top right corner of the pop-up. Click to generate a report.
-
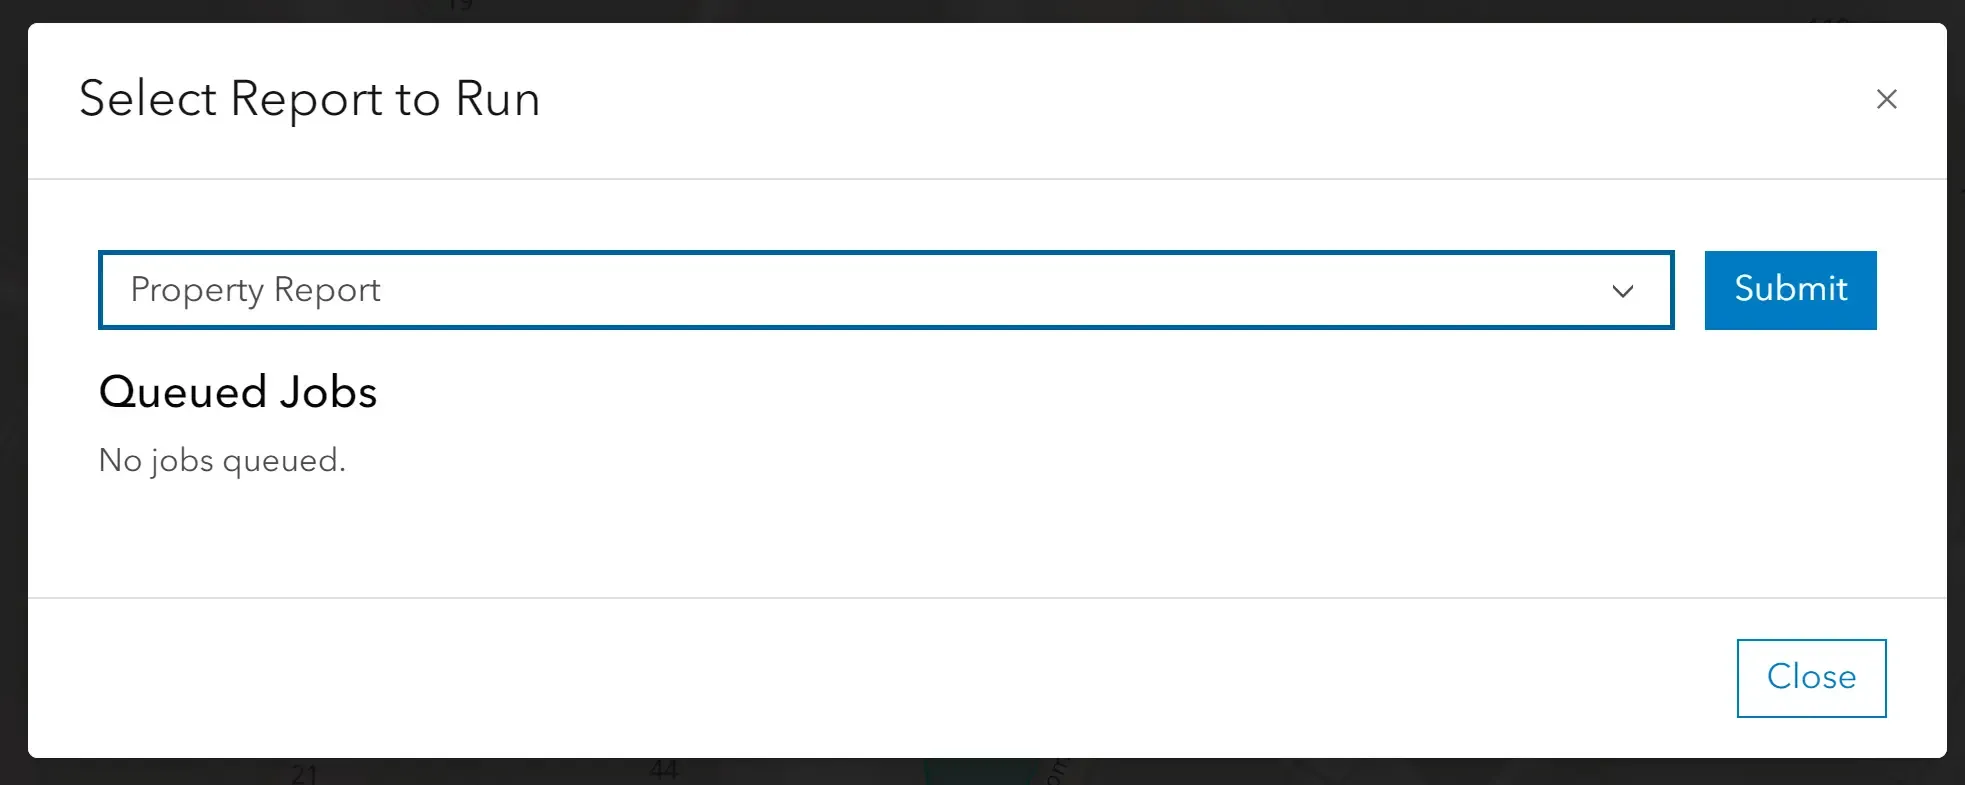
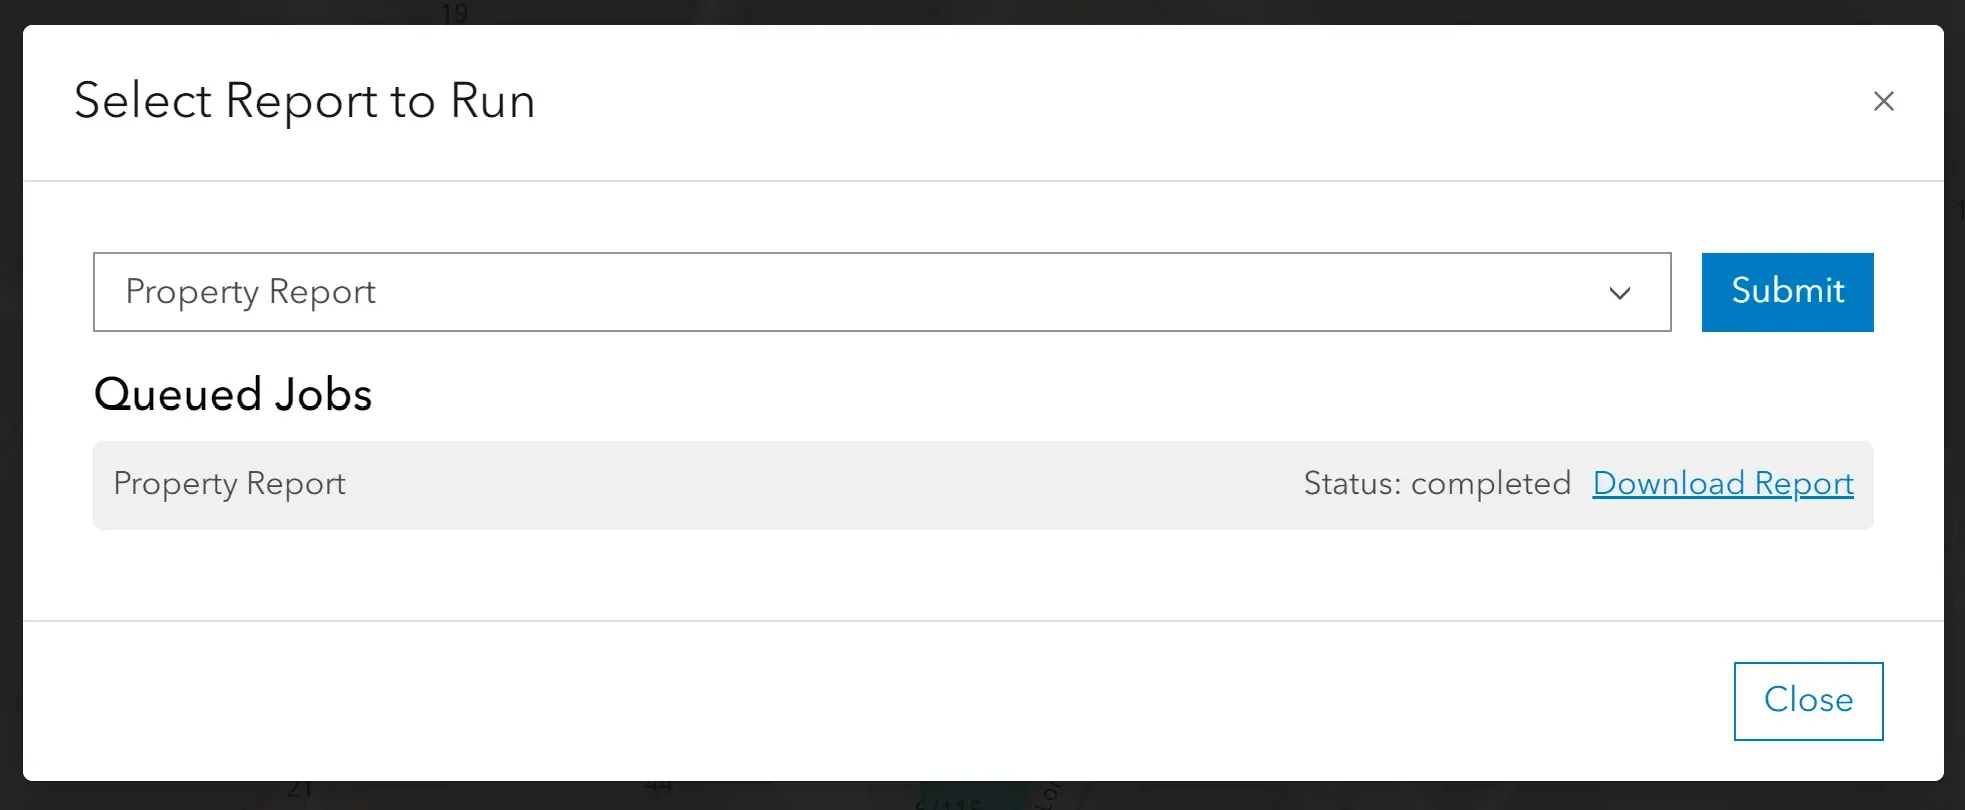
Select the report from the drop-down and click on submit to generate a report based on the feature selected.
-
Once the report is generated, the status message will change to complete, and you will get a clickable link. Click on the ‘Download Report’ to get the file downloaded to your locale.
Generating reports with secure data sources (available from v3.2 and above)
You are able to create reports with results from secure data source connections. This can be identified through the notification shown below on the report creation page.
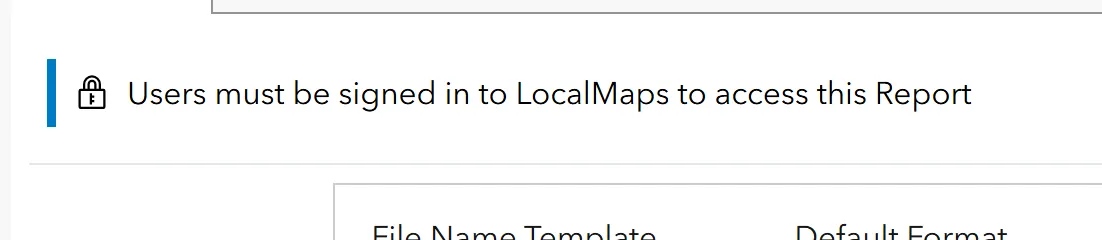
These reports can only be generated through the viewer when the users are logged in through any configured methods.