Elevation Profile Widget
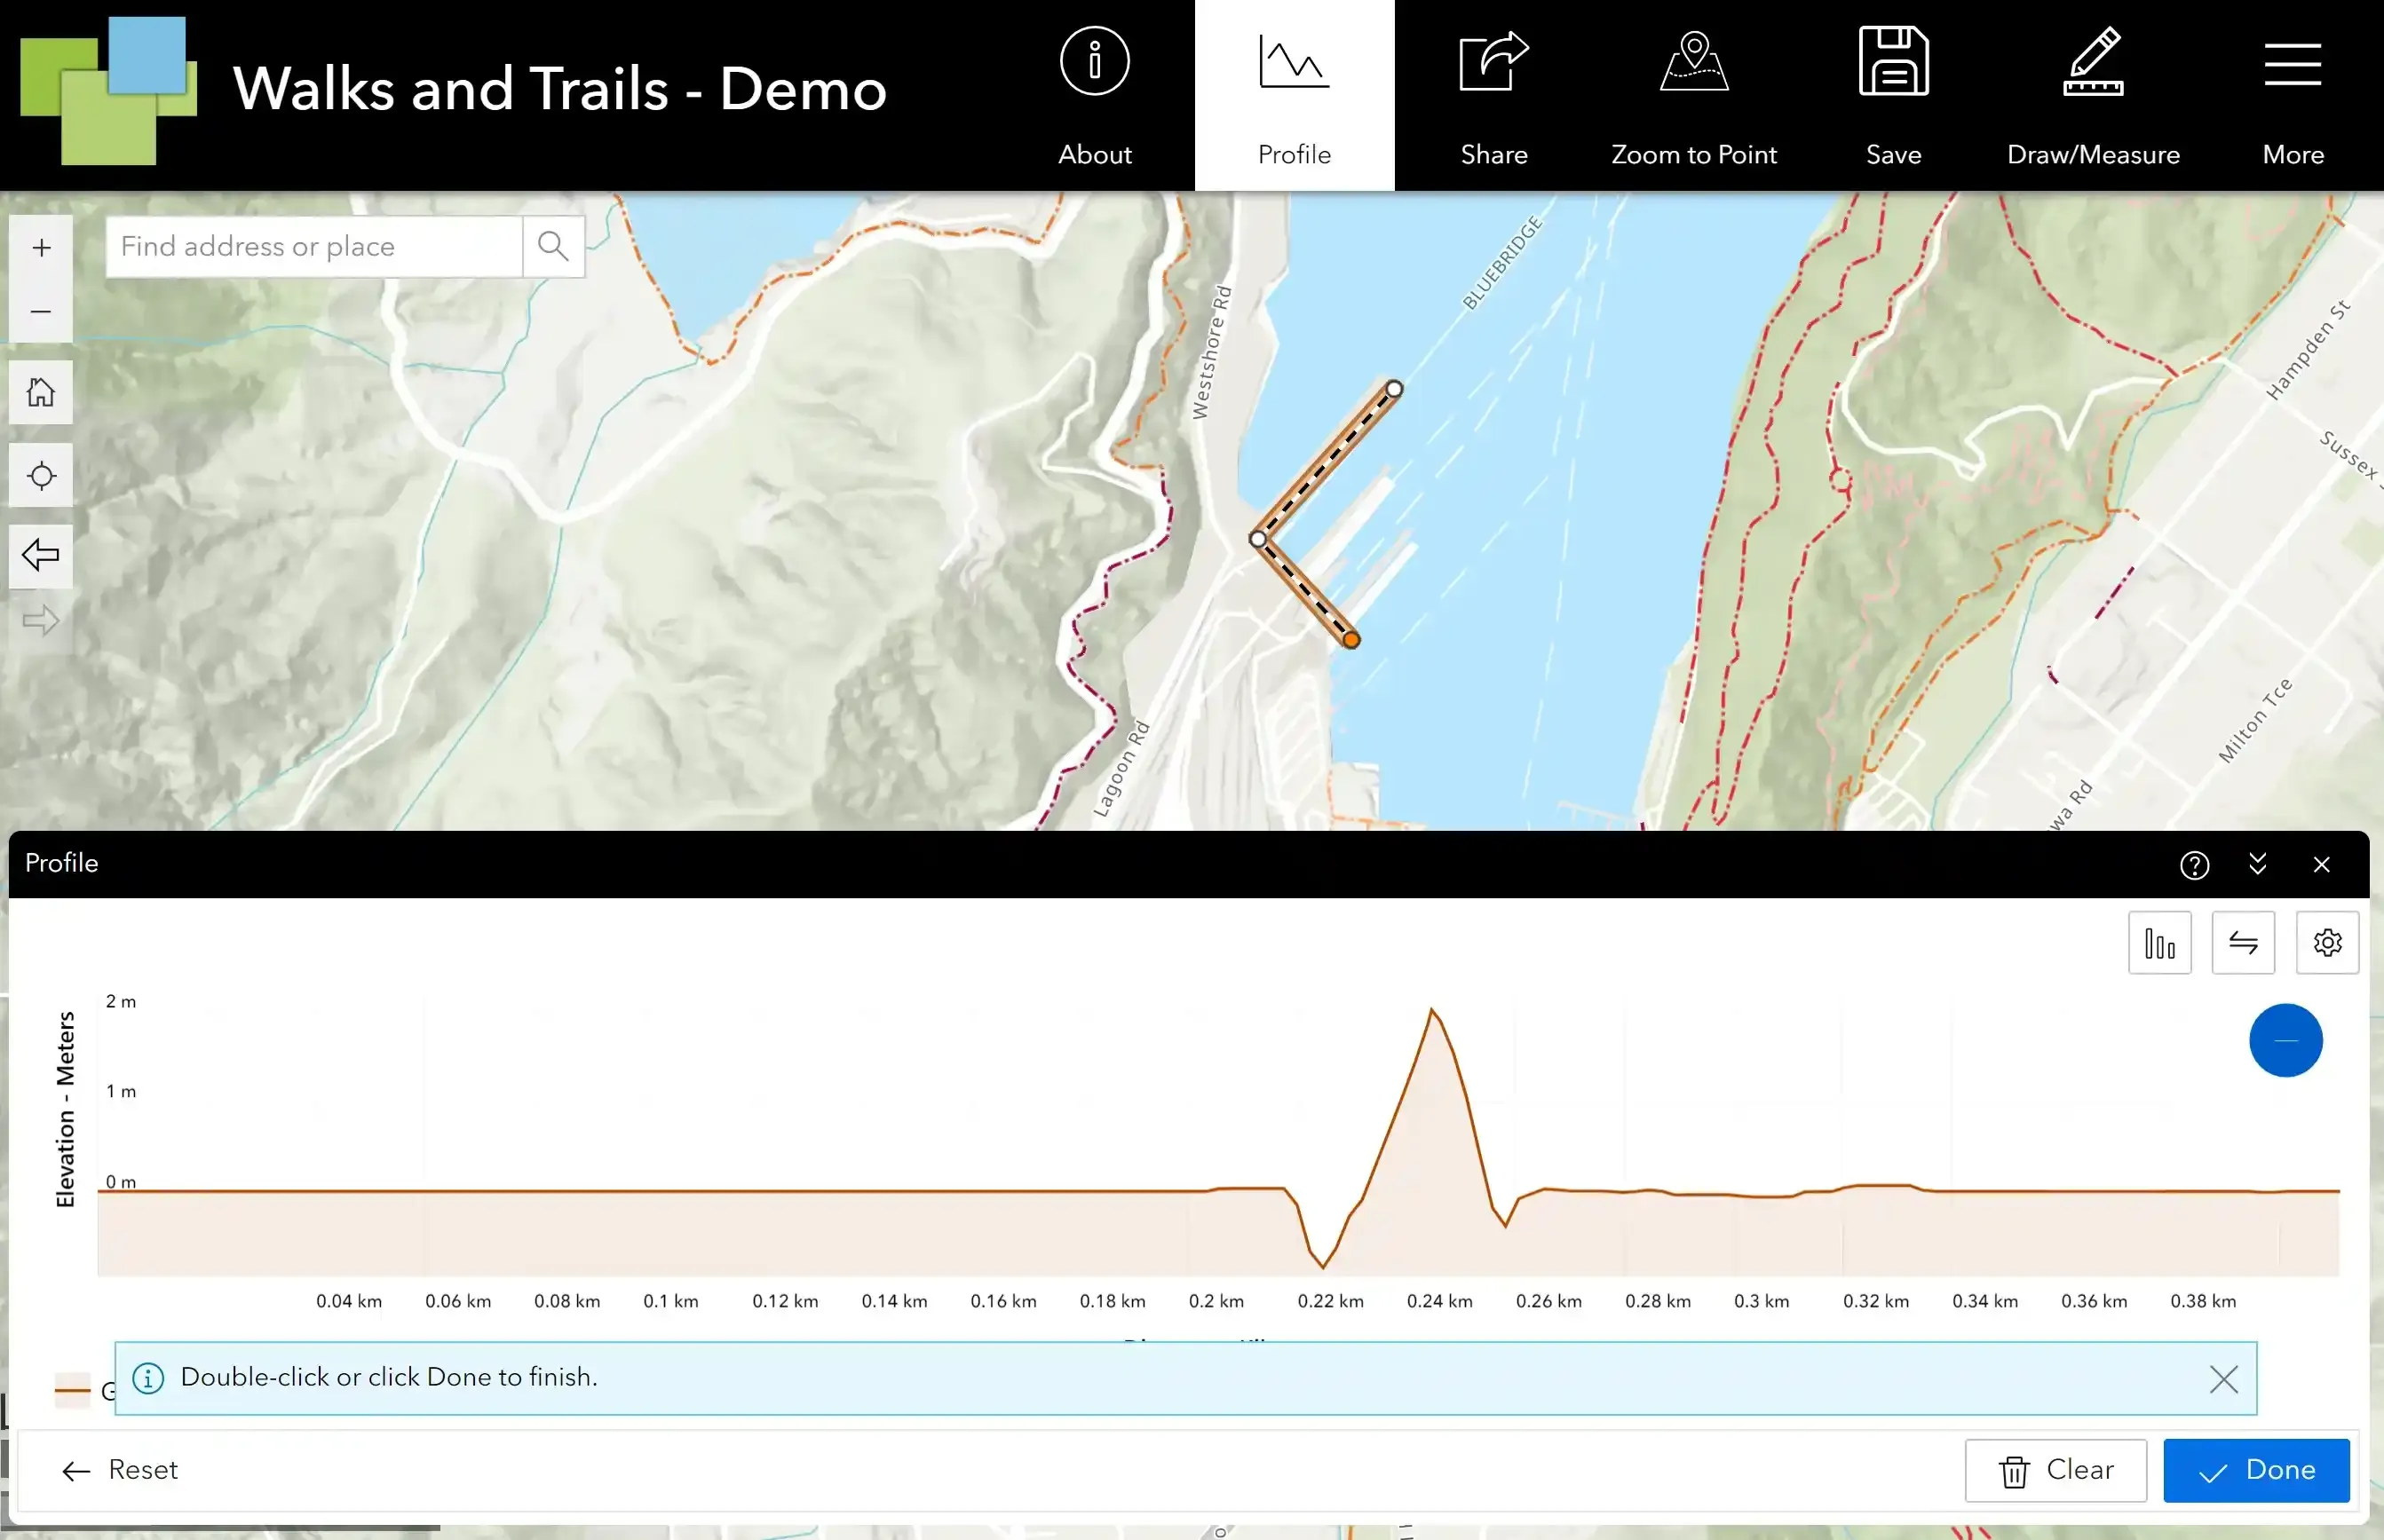
The Elevation Profile Widget allows you to interactively draw a line and generate an elevation profile. Alternatively, you can select a line feature on the map and use this as the input for the elevation profile. Once executed, a cross sectional profile will appear along the bottom of the screen.
How to Use the Elevation Profile Widget
Drawing a Line
-
Click on the Elevation icon to open the Widget. The panel will appear horizontally at the bottom of your screen. Click Draw Profile.
-
You can then click on the map to draw a polyline. Double click to finish drawing the line.

-
Results are in the Profile Result tab of the Widget. Hover over or touch the Elevations Profile chart to display elevations and show location on map.

-
The polyline can be adjusted by selecting it and dragging it around the map.
-
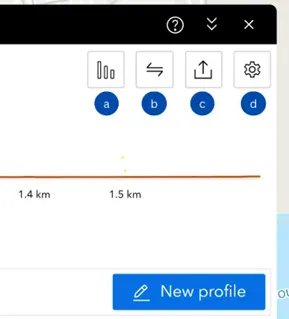
In the top right there are the following options

a. Profile Statistics - This popup provides a summary of terrain metrics including minimum, maximum, and average elevations, positive and negative slope characteristics, total elevation gain and loss, and the maximum distance covered.
b. Reverse Direction - Reverse the direction of the profile
c. Export Profile - Export’s the values to a CSV file. There is a toggle to customise intervals.
d. Settings - Choose elevation units, distance units, intersection buffer and a checkbox to enable uniform scaling.
-
Clicking New Profile allows you to redraw on the map, or alternatively clicking reset will reset the Widget to the default.
Selecting a Line Feature
-
Click on the Elevation icon to open the Widget. The panel will appear horizontally at the bottom of your screen. Click Select Line.
-
Click on the map to select a line feature. The profile will be generated based on the selected line feature.

